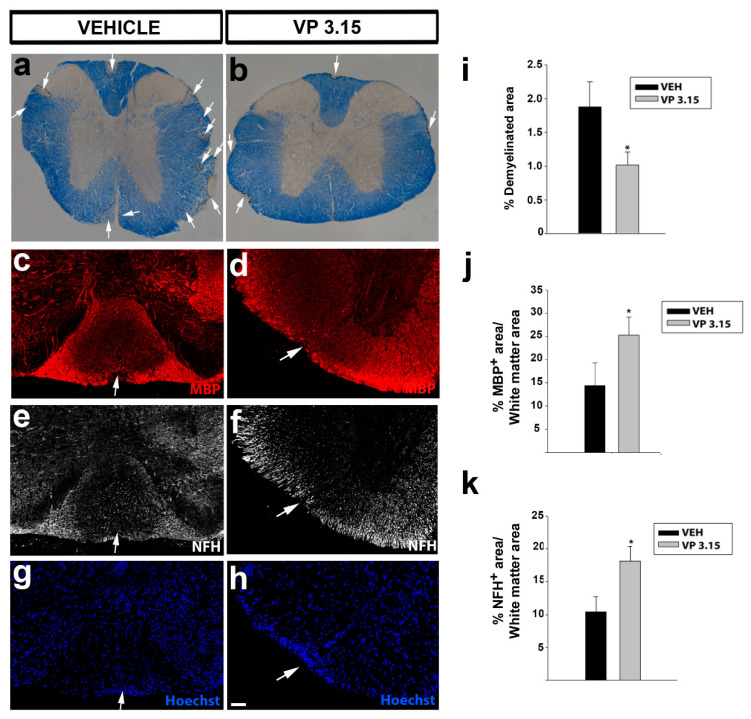
Figure 4.
The spinal cord of VP3.15-treated mice presented a lower level of demyelination and axonal damage; (a,b): Panoramic views of the spinal cord stained with eriochrome cyanine of vehicle (a) and VP3.15-treated mice (b). The demyelinated area is delimited by the dashed line and arrows. Scale bar represents 200 µm in a,b; (c–h): Detailed views of the spinal cords of vehicle (left) and VP3.15-treated mice (right), labelled for MBP (red), NFH (grey), and nuclei (Hoechst staining; blue). Lesions are identified as an accumulation of nuclei; (i): Graph showing a decreased percentage of demyelinated area respect to the white area in the VP3.15-treated mice; (j,k): Histograms showing a significant increase in the percentage of both MBP+ (j) and NFH+ (k) area in the VP3.15-treated compared to the vehicle-treated mice. Scale bar represents 200 in a,b and 50 µm in c–h. Abbreviations: MBP = myelin basic protein; NFH = neurofilament heavy. Results of Student’s t-test are represented as: * p < 0.05. EAE-VEH: n = 7; EAE-VP3.15: n = 10.

