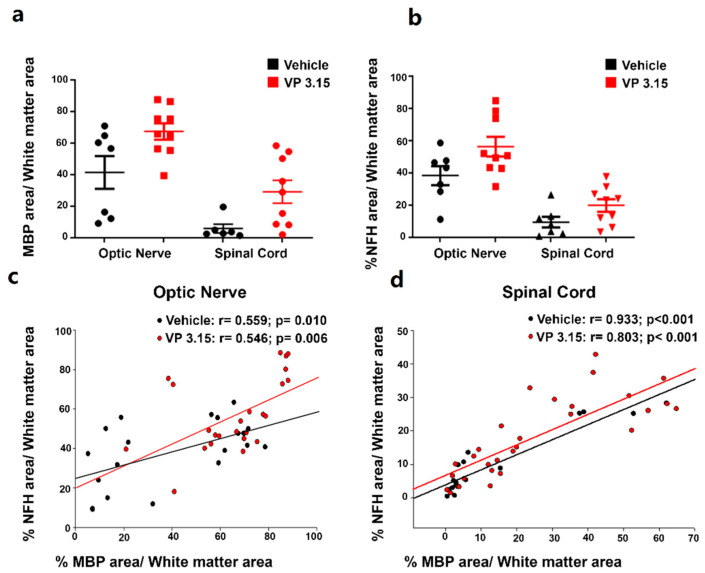
Figure 5.
Axonal integrity is higher when the myelin is better preserved; (a,b): Graphs showing the percentage of MBP (a) and NFH (b) area respect to the total white matter area between structures; (c,d): Graphs showing the results of Pearson´s correlation tests between the normalized MBP area and the normalized axonal area among treatments and in the optic nerve (c) and spinal cord (d). EAE-VEH: n = 7; EAE-VP3.15: n = 10.

