Figure 7.
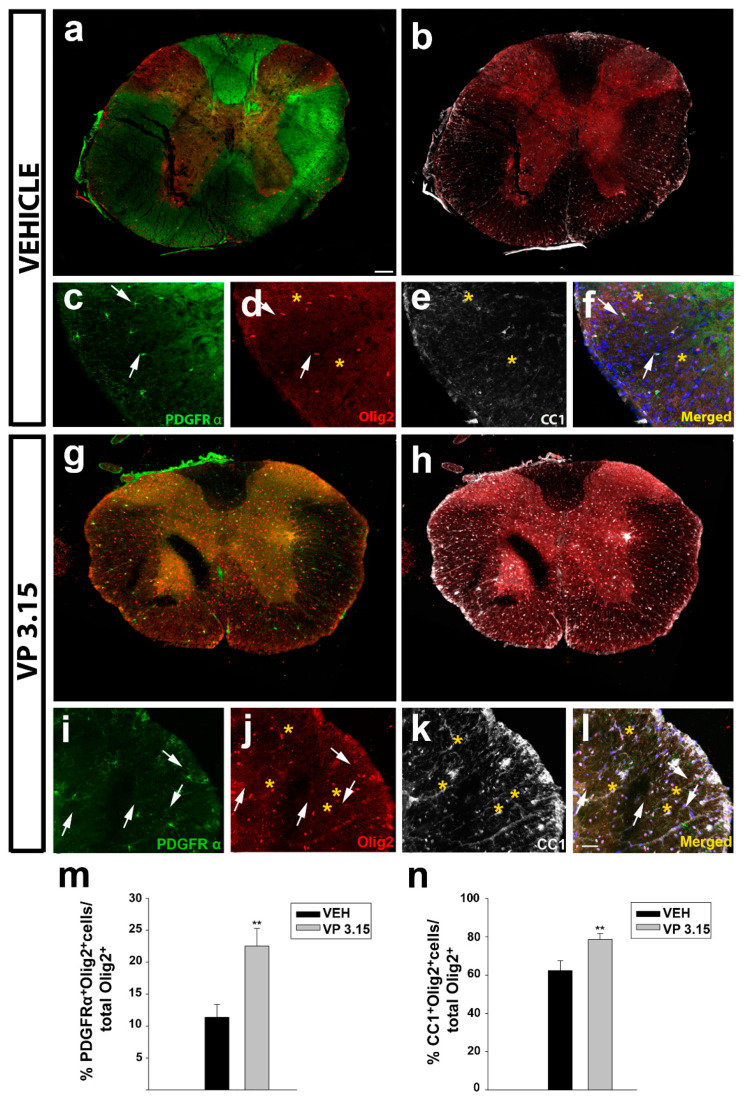
The treatment of EAE mice with VP3.15 promotes the presence of both precursor and mature oligodendrocytes in spinal cord; (a–l): Representative panoramic views (a,b and g–h) and detailed images (c–f and i–l) of the spinal cords of vehicle (a–f) or VP3.15 treatment (g–l). Cells are labelled for PDGFRα (green), Olig2 (red), CC1 (grey), and merged, that includes nuclei (Hoechst; blue). Arrows point to PDGFRα+Olig2+ cells, and asterisks to CC1+ Olig2+ cells. Scale bar in a, b, g, and h represents 200 µm and the rest represents 50 µm; (m,n): Graphs showing the significant increase in the percentage of PDGFRα+Olig2+ cells (m) and Olig2+ CC1+ cells (n) after the treatment with VP3.15 compared to the vehicle. Results of Student’s t-test are represented as: ** p < 0.01. EAE-VEH: n = 7; EAE-VP3.15: n = 10.

