Figure 2.
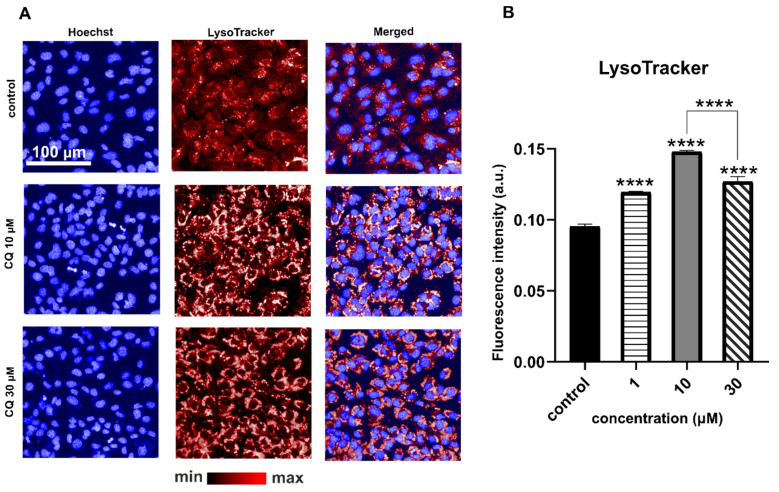
Representative fluorescence images of LysoTracker Deep Red staining of HMEC-1 for control and CQ-treated cells (A). Quantification of the fluorescence intensity (B); ANOVA **** p-value < 0.0001) for LysoTracker reveals significantly increased lysosomal volume for cells treated with 1, 10, 30 µM CQ in comparison to the untreated control. Average fluorescence value from three wells was quantified from >9000 cells per well. Results were obtained from three independent experiments. Color differences in the fluorescence image are related to the background noise and maximum values of the fluorescence intensity for control and CQ-treated cells.

