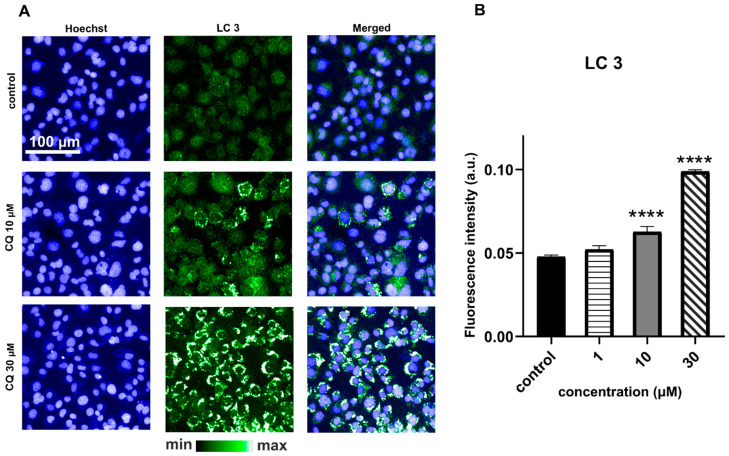
Figure 4.
Immunofluorescence images of LC3 staining of HMEC-1 for control and CQ-treated cells (A). Quantification of the LC3 fluorescence intensity (B; ANOVA **** p < 0.0001) showed significantly increased autophagosome numbers for cells treated with 10 and 30 µM CQ in comparison to the untreated control. The average fluorescence value from three wells was quantified from >9000 cells per well. Results were obtained from four independent measurements in reference to the untreated control.

