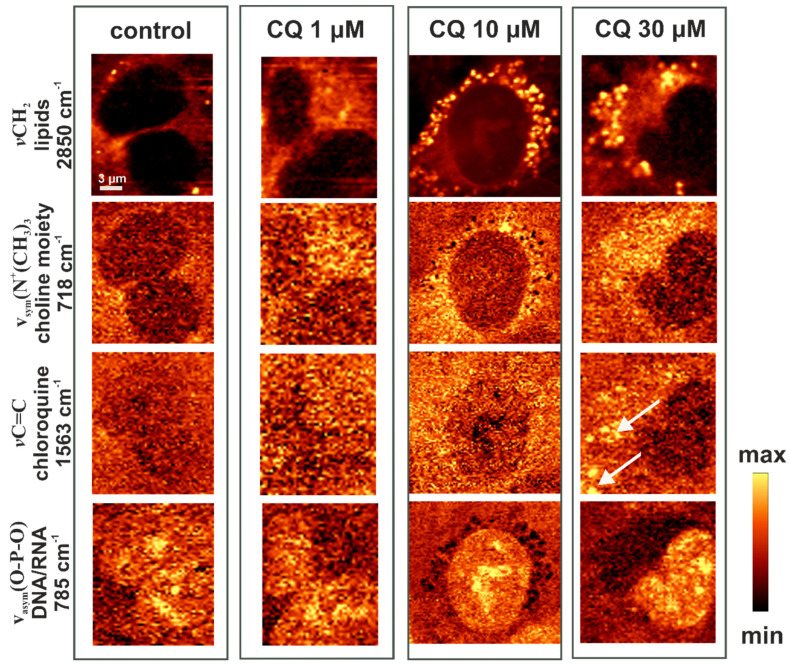
Figure 5.
Examples of Raman images of the HMEC-1 cells: the control cells and cells incubated with 1, 10, and 30 µM of CQ for 24 h. Raman maps based on specific bands were obtained with a 532 nm laser wavelength and with a sampling density of 0.3 μm, which clearly shows the lipid accumulation in the CQ-treated cells. Arrows indicate CQ accumulations in cells.

