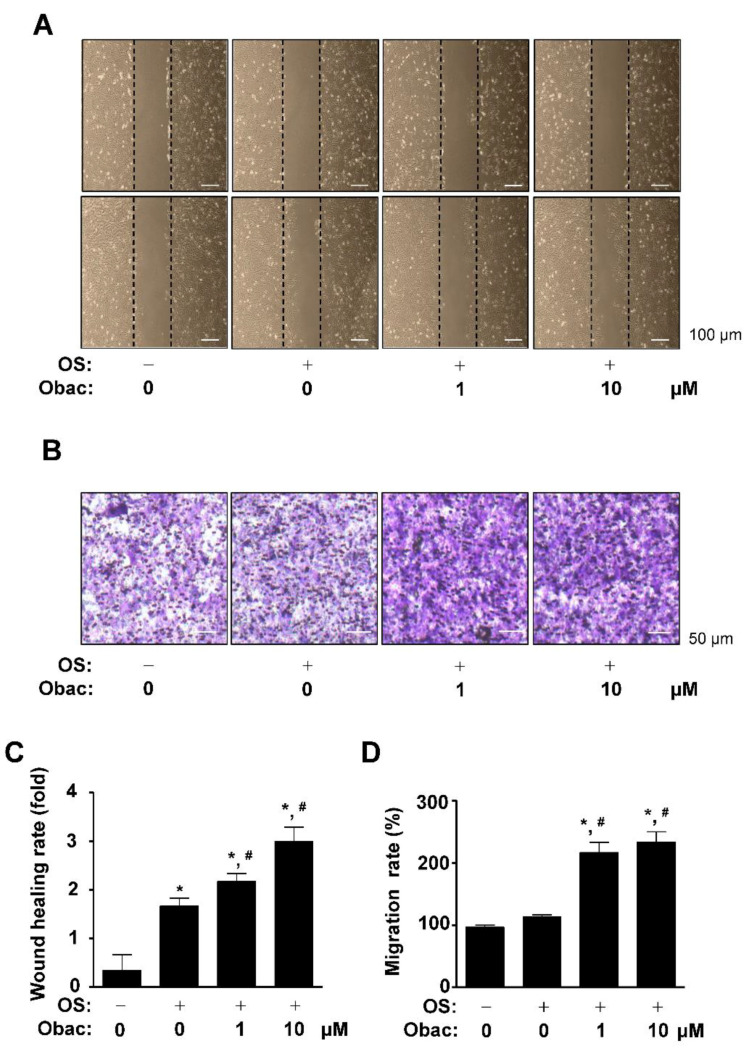
Figure 2.
Effects of Obac on cell migration in osteoblast differentiation. (A,C) MC3T3-E1 was cultured in osteogenic supplement medium (OS) in the absence or presence of Obac (1–10 µM) for 24 h. Cell migration was observed under a phase contrast microscope (A), and the cell migration rate (fold) was measured by the area enclosing the spreading cell population and expressed as a bar graph (C). (B,D) The Boyden chamber assay was performed and observed under a phase contrast microscope (B), and migration rate (%) was normalized to the control and expressed as a bar graph (D). Data are representative of three independent experiments, and values are expressed as the mean ± S.E.M. * p < 0.05 indicates statistically significant differences, compared with the control. #: statistically significant differences compared with OS (# p < 0.05).

