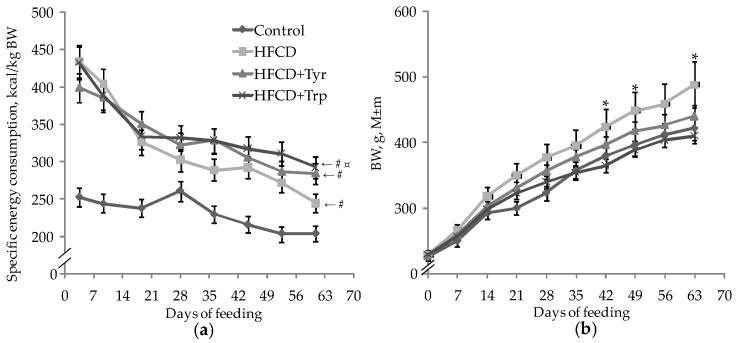
Figure 1.
Changes in specific dietary energy consumption per kg body weight (a) and body weight (b) of rats in the control and experimental groups during the experiment. * the distribution is heterogeneous, p < 0.05, ANOVA by the factor “Trp”; # the difference with the control group is significant; ¤ the difference with the HFCD group is significant, p < 0.05, t-test for pairwise comparisons of group mean values. The number of animals in the groups was 8.

