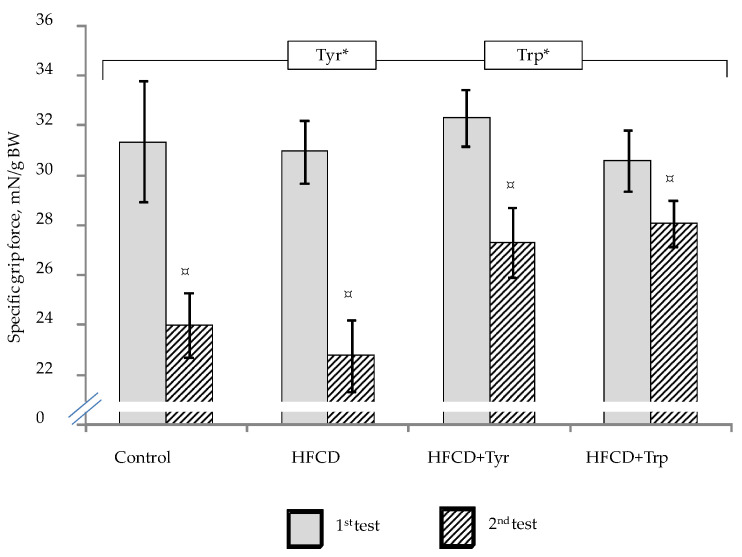
Figure 3.
Muscle compression force (specific grip force of the forepaws) in rats during the first and second testing, mean ± standard error of the mean. The bracket above the bars denotes significant dependence on the factors: “Tyr” and “Trp”, p < 0.05, 3-way ANOVA. * only in the second test; ¤ the difference between the first and second tests is significant, p < 0.05, Wilcoxon’s criteria for pairwise comparisons. The number of animals in the groups was 8.

