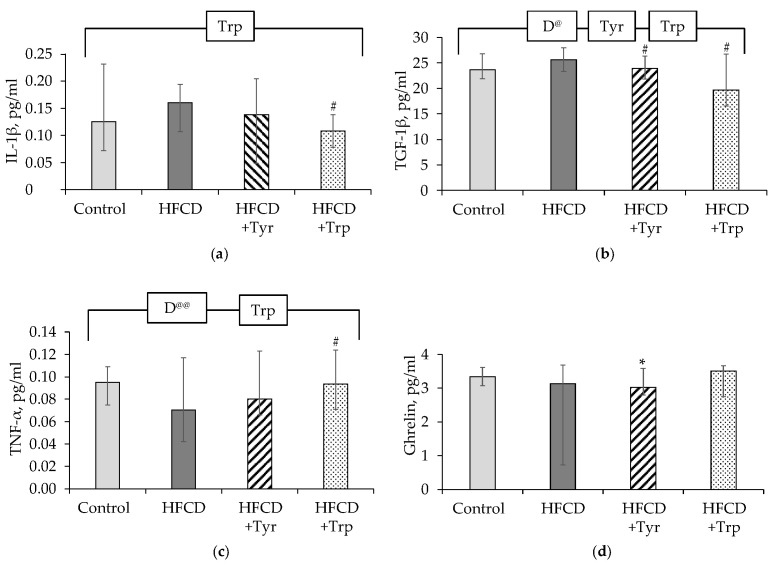
Figure 7.
Levels of cytokines and adipokines in the lysates of white adipose tissue in the rats, median ± intervals of change: IL-1β (a), TGF-1β (b), TNF-α (c), ghrelin (d). * the difference with the control group is significant; # the difference with the group receiving HFCD is significant, p < 0.05, Mann-Whitney test. The bracket above the bars denotes significant dependence on the factors: “diet” (D), “tyrosine” (Tyr), “tryptophan” (Trp), p < 0.05, 3-way ANOVA. Indices @ excluding rats receiving Trp, @@ excluding rats receiving Tyr. The numbers of animals in the groups were 8.

