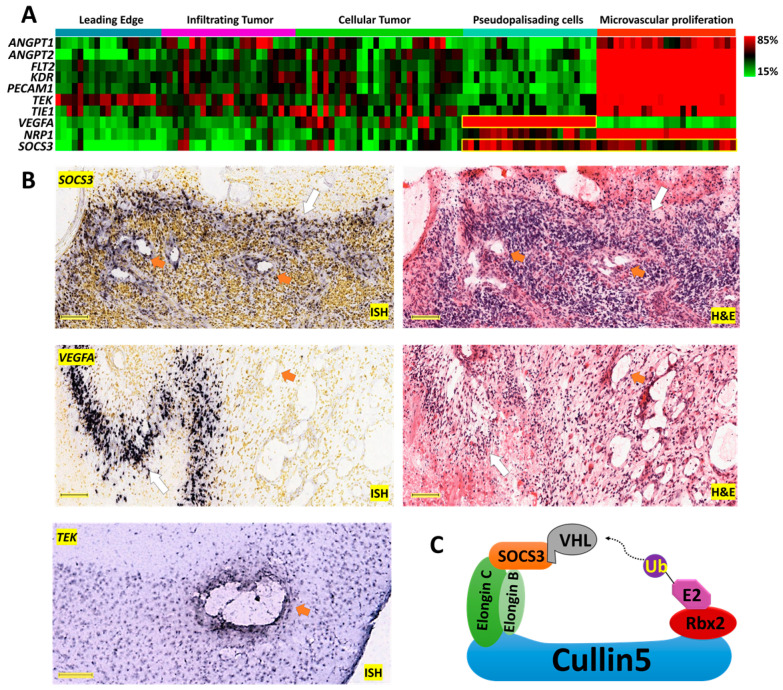
Figure 1.
Anatomical mapping of SOCS3 and angiogenic genes in glioblastoma (GBM) clinical samples. (A) Expression levels of angiogenesis markers ANGPT1, ANGPT2, FLT1, PECAM1, TEK, TIE1, VEGFA, NRP1, and KDR are mapped on corresponding anatomical structures. The yellow squares highlight the anatomical expression patterns of VEGFA and SOCS3. (B) In situ hybridization (ISH) and hematoxylin and eosin (H&E) analysis of SOCS3 and VEGFA in GBM patients, Scale bar: 200 μM. ISH analysis of TEK in normal murine cranial tissue. Scale bar: 150 μM. Image credit: Ivy-GAP, Allen Institute. Orange arrows indicate blood vessels. White arrows indicate pseudopalisading cells around necrosis. (C) Schematic overview of the CRL5 E3 ligase. SOCS3 in the CRL5 can recruit von Hippel–Lindau (VHL) for polyubiquitination and degradation.

