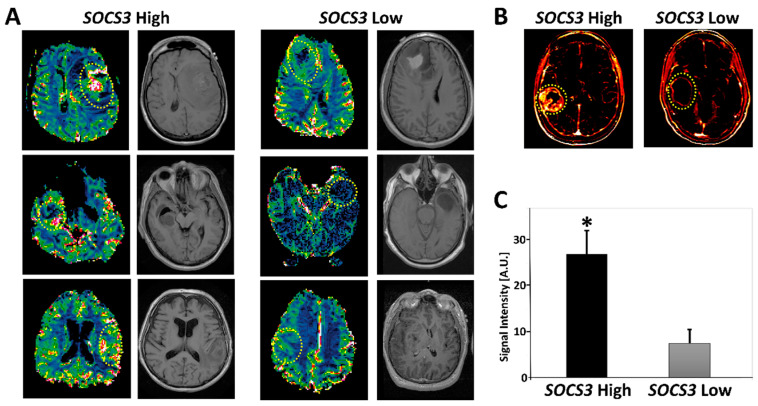
Figure 5.
Radiogenomics of SOCS3 expression in GBM. (A) Representative dynamic susceptibility contrast-MRI (DSC-MRI) images with higher than the median SOCS3 expression and lower than the median SOCS3 levels. Circles represent regions of interest (ROIs). (B) Dynamic contrast-enhanced (DCE)-MRIs of higher than the median (TCGA-06-5412) and lower than the median (TCGA-06-2570) SOCS3 expressions. (C) Quantification of 3D tumor volume perfusion intensity in groups with differential SOCS3 expression levels. *: p < 0.05.

