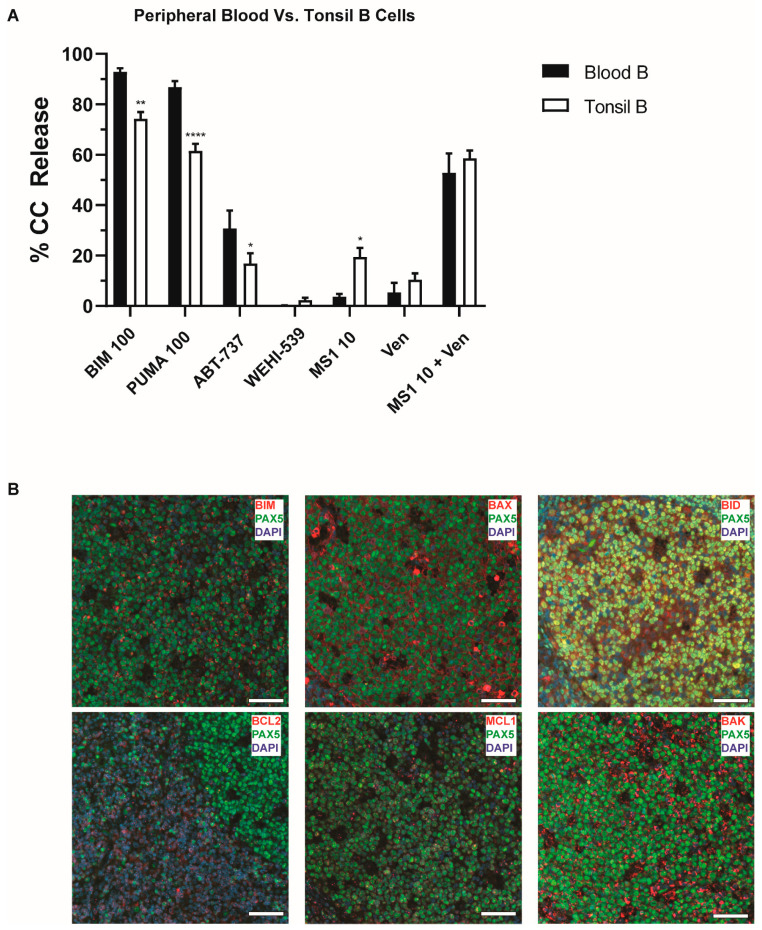
Figure 2.
BH3 profiling of peripheral blood (PB) and tonsil B cells. (A) The percentage of cells undergoing cytochrome c release is displayed on the y-axis according to different cell subsets identified on the x-axis. Shown is the comparison of frozen B lymphocytes from tonsils and peripheral blood. Tonsillar B cells have lower responses to BIM and PUMA, while showing increased responses to MS1. Bars represent the mean ± standard error of the mean (SEM). Analysis was carried out using a 2-way ANOVA comparing peptide exposure or subtype with cytochrome c release. * p < 0.05, ** p < 0.01, **** p < 0.0001. (B) Representative merged immunofluorescence (IF) images of normal tonsil. Images were taken on a 20× objective highlighting staining of DAPI (blue), PAX5 (green, AF594) and the protein of interest (red, AF647). Scale bars represent 50 µm. Pro-apoptotic proteins are expressed in normal germinal center (GC) cells, along with MCL1. BCL2 expression is confined to the edges of the GC follicle and PAX5 negative cells.

