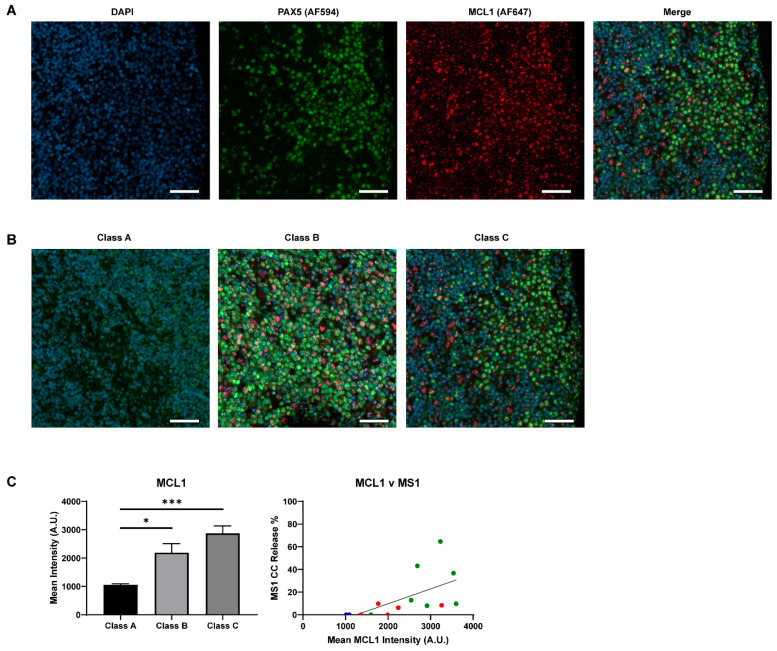
Figure 5.
Expression of MCL1 in DLBCL by immunofluorescence. (A) Representative 20× single channel images of DAPI (blue), PAX5 (green, AF594), and MCL1 (red, AF647), as well as a merged image, in a class C sample. Scale bars represent 50 µm. (B) Qualitative comparison of MCL1 expression in class A, B, and C samples. The same sample from panel A is used in this panel. PAX5 staining was weak in class A when co-stained with MCL1, but this tissue was confirmed to be PAX5 positive in previous stains. Scale bars represent 50 µm. (C) The mean pixel intensity of all samples in each class, as calculated by Qupath. T-test with Welch’s correction was used to compare columns, bars represent the mean ± standard error of the mean (SEM). Spearman linear regression analysis was applied to analyze the correlation between cytochrome c release to MS1 (10 µM) and mean MCL1 intensity (R2 = 0.3525). Dot colors represent class of sample: A (blue), B (red), C (green). Response was only seen in class C samples with high MCL1 expression and mean MCL1 expression was lower in Class A/B samples * p < 0.05, *** p < 0.001.

