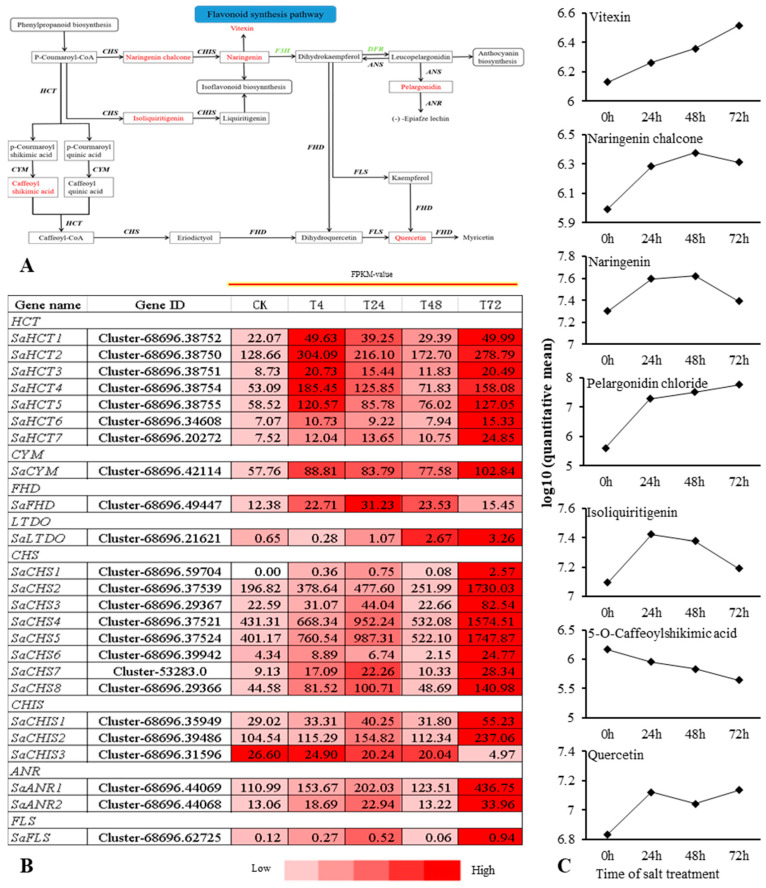
Figure 7.
Overview of the relationship between DEGs and DMs in the FSP of S. alopecuroides under salt stress. (A) Overview of flavonoid biosynthesis. (B) Heat map of flavonoid biosynthesis-related gene expression. Values are the average FPKM value of each sample in each group. HCT, shikimate O-hydroxycinnamoyltransferase; CHS, chalcone synthase; CHIS, chalcone isomerase; CYM, coumaroylquinate (coumaroylshikimate) 3′-monooxygenase; FHD, flavonoid 3′,5′-hydroxylase; FLS, flavonol synthase; ANR, anthocyanidin reductase; ANS, leucoanthocyanidin dioxygenase. (C) The trend of flavonoid synthesis pathway DMs changes with salt stress. Expression scores are shown as log10(q).

