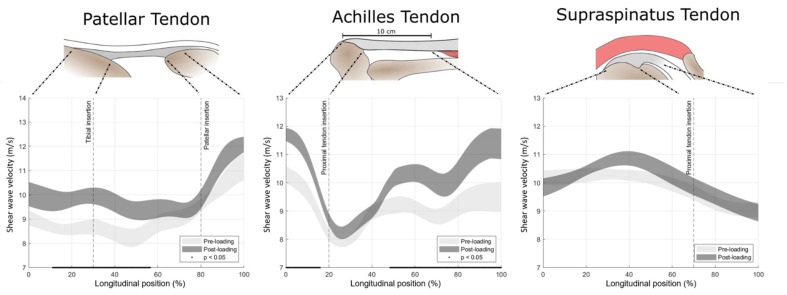
Figure 6.
Top row: schematic representation of the assessed structures with the anatomical landmarks used for spatial referencing. Bottom row: areas of uncertainty around the estimate of the mean (±SE) shear wave velocity before and after 15 s maximum voluntary isometric tendon loading over the longitudinal axis of the tendon. Longitudinal positions with a statistically significant load response are underlined with a black line.

