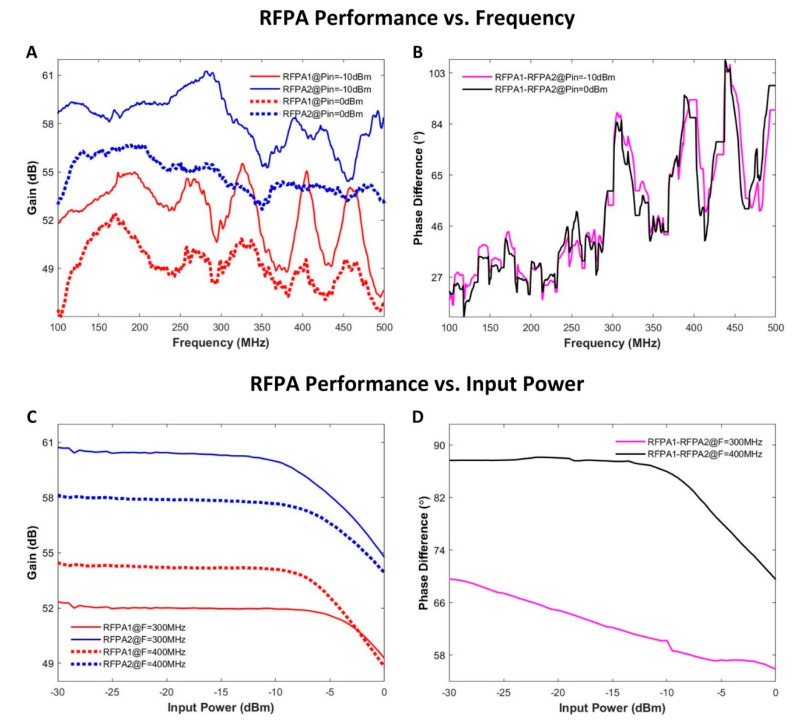
Figure 6.
Summary of RFPA characterization results. (A) The gain of the two RFPAs was measured at two input levels (−10 and 0 dBm) for a frequency range of 100–500 MHz in increments of 1 MHz. (B) The phase difference between the outputs of the two RFPAs against frequency at different input power levels. (C) The gain of the two RFPAs was measured at two frequencies (300 and 400 MHz) with the input power level varying from −30 to 0 dBm using an increment of 0.5 dBm. (D) The phase difference between the outputs of the two RFPAs against input power level at different frequencies.

