Figure 7.
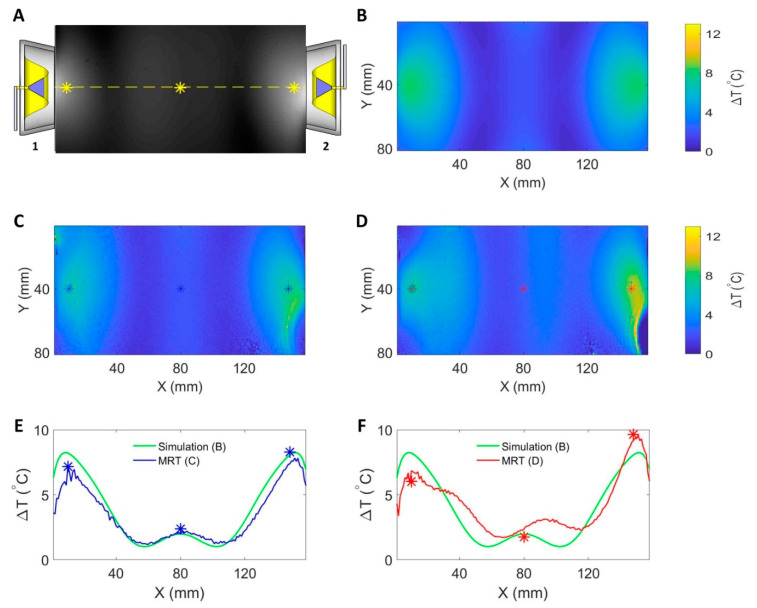
Summary of RF induced temperature changes (ΔT) obtained from numerical simulations and experiments (f = 400 MHz, t = 10 min, and Pin at port = 17.78 W) with each RFPA being connected to an SGBT antenna. (A) The position of the antennas and an axial MR image through the center of the phantom. The yellow line indicates the coronal centerline. The yellow stars mark the positions of the fiber optic temperature sensors. A transversal slice in the middle of the phantom aligned with the center of the RF applicator was selected for data analysis. (B) The temperature changes obtained from the temperature simulation. The middle row shows maps of temperature changes derived from MR thermometry for RF heating with (C) and without (D) the supervision module in the control loop regulating the RF signals. The stars in (C,D) indicate the positions of the fiber optic temperature sensors. The bottom row depicts ΔT profiles obtained for the centerline drawn through the center slice of the phantom for temperature simulations (B), experimental RF heating with (C) and without (D) the supervision module in the control loop. The blue and red stars indicate readings from the temperature sensors. A constructive interference pattern that was similar to the simulation result was observed in the middle of the phantom when the supervision module was activated in the loop (E). The interference pattern was distorted when the supervision module was not in the loop (F). For this case, the peak of the experimental interference pattern was shifted 16 mm to the right versus the reference obtained from the temperature simulation.

