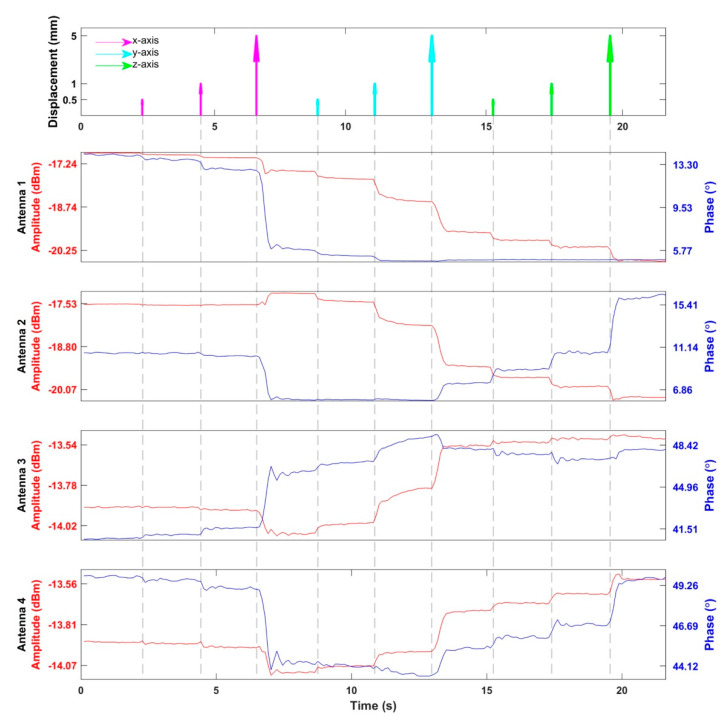
Figure 9.
Detection of head motion. The top figure indicates the timing and displacements of the movements of the head model. There were three movements with the distance of 0.5, 1.0, and 5.0 mm along each direction. The following four figures show the amplitude and phase of the reflected RF signals from the SGBT antennas detected by the supervision module. The curves drawn in red represent the amplitudes of the reflected signals, while the curves in blue represent the phases of the reflected signal relative to the transmitted/reference signal.

