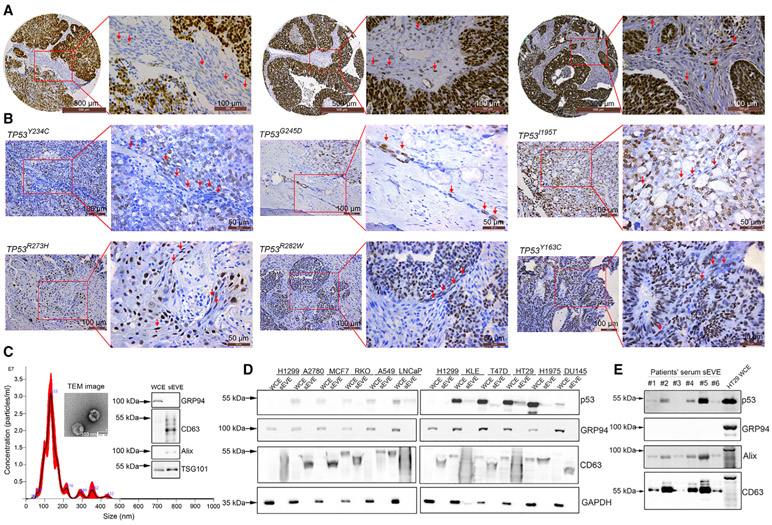
Figure 1. Presence of p53 protein in fibroblasts and small EVs.
(A) Immunohistochemical staining of tumor (left panel) and stromal (right panel) cells for p53 in patient-derived high-grade serous ovarian cancer (HGSOC). Red arrows show p53-positive fibroblasts. Scale bars, 500 μm (left) and 100 μm (right).
(B) Immunohistochemical staining for p53 protein in HGSOC samples with hotspot TP53 mutations. Red arrows show p53-positive fibroblasts. Scale bars, 100 μm (left) and 50 μm (right).
(C) Size of the small EVs used as determined via nanoparticle tracking analysis (NTA). Transmission electron microscopy (TEM) images of small EVs and western blotting for the small EV-positive (CD63, TSG101, and Alix) and negative (GRP94) markers. The small EVs were isolated from HT29 cells. Scale bar, 100 nm
(D) Expression of p53 protein in a panel of 10 cell lines and small EVs derived from these cell lines. H1299 is a p53 null cell line that was used as a negative control.
(E) Expression of p53 protein in serum small EV extract (sEVE) from ovarian cancer patients. HT29 whole-cell extract (WCE) was used as a positive control for GRP94.

