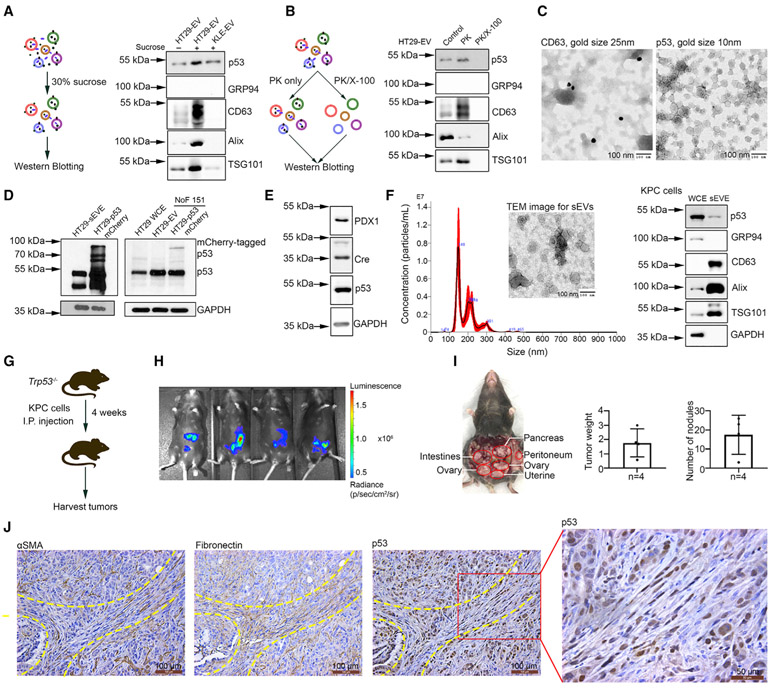
Figure 2. Transfer of p53 protein to fibroblasts from cancer cells via small EVs.
(A) Schema of 30% sucrose/D2O ultracentrifugation assay and western blotting for p53 expression after purification.
(B) Schema of proteinase K digestion assay and western blotting for p53 expression in small EVs. PK, proteinase K; X-100, Triton X-100.
(C) Immuno-gold staining for CD63 and p53 in small EVs isolated from HT29 cells. Small EVs were from the same vial and aliquoted equally for CD63 and p53 staining. Gold size of anti-rabbit IgG for CD63 protein, 25 nm; gold size of anti-mouse IgG for p53 protein, 10 nm. Scale bar, 100 nm.
(D) mCherry-tagged p53 expression in NoF 151 fibroblasts after co-culture with tumor cells. HT29 WCEs were used as a negative control for mCherry-tagged p53 expression.
(E) Expression of PDX1, Cre recombinase, and p53 protein in KPC cells.
(F) Characterization of small EVs isolated from KPC cells according to NTA, TEM, and western blotting. Scale bar, 100 nm.
(G) Schema of in vivo study related to Trp53−/− mice. I.P., intraperitoneal.
(H) The bioluminescence image from the IVIS imager showing the tumor take rate 10 days after cell injection.
(I) The location, tumor weight (g), and number of nodules of KPC xenograft tumors. Data are represented as mean ± SD.
(J) Immunohistochemical staining for p53 protein using a CM5p antibody and fibroblast markers (αSMA and fibronectin) on adjacent slides of KPC xenograft tumor tissues. Scale bars, 100 μm and 50 μm.

