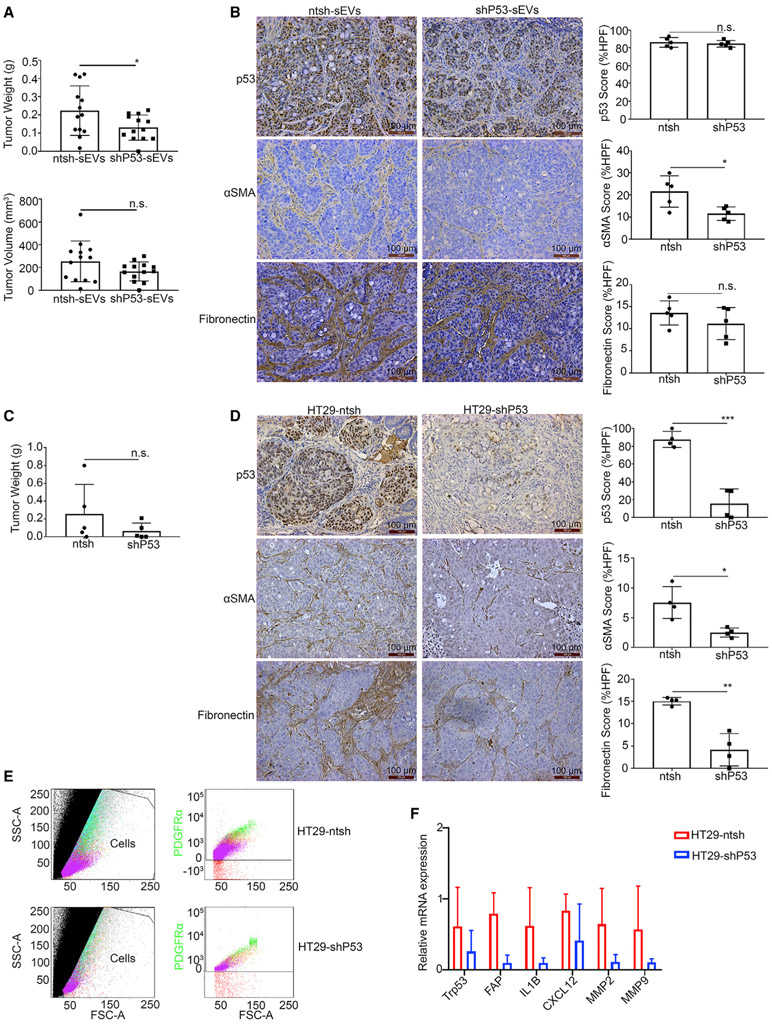
Figure 5. Small GOF p53-containing EVs promote tumor growth and CAF transformation in mouse models.
(A) Tumor weights and volumes in mice inoculated with HT29 cells subcutaneously. Data are represented as mean ± SD. *p < 0.05; n.s., not significant.
(B) Comparison of p53, αSMA, and fibronectin expression in mice tumors injected with ntsh-sEVs and shP53-sEVs according to IHC. The IHC score was analyzed based on the expression area and calculated using the IHC toolbox in the ImageJ software program. Data are represented as mean ± SD. *p < 0.05; n.s., not significant. Scale bar, 100 μm.
(C) Tumor weights obtained from mice inoculated with HT29-ntsh and -shP53 cells orthotopically. Data are represented as mean ± SD. n.s., not significant.
(D) Comparison of p53, αSMA, and fibronectin expression in the HT29-ntsh and HT29-shP53 groups based on an IHC assay. HPF, high-power field. The IHC score was analyzed based on the expression area and calculated using the IHC toolbox in the ImageJ software program. Data are represented as mean ± SD. *p < 0.05; **p < 0.01; ***p < 0.001. Scale bar, 100 μm.
(E) The populations of fibroblasts positive for the surface maker PDGFR-α as revealed by FACS flow cytometry. SSC, side scatter; FSC-A, forward scatter area.
(F) The quantitative real-time RT-PCR results for Trp53, FAP, IL1B, CXCL12, MMP2, and MMP9 in fibroblasts isolated from tumors using FACS. Data are represented as mean ± SD.
See also Figure S5.

