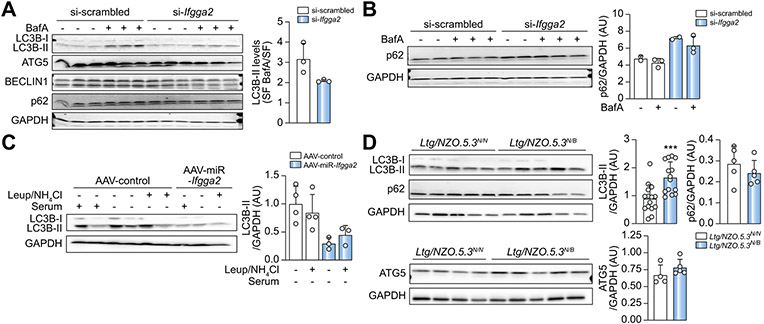
Fig. 6. Suppression of IFGGA2 reduces autophagy.
(A) Western blotting and quantification of autophagy proteins in siRNA-transfected primary hepatocytes treated ± BafilomycinA for 2 h (n = 3). (B) Analysis and quantification of p62 in siRNA-transfected hepatocytes treated ± BafilomycinA for 24 h (n = 2–3). (C) Ex vivo flux assay from liver explants of AAV-Control (n = 4) and AAV-miR-Ifgga2 (n = 3) mice. Quantification also includes data of Fig. S11. Data are expressed as fold of control. (D) Analysis of autophagy proteins in livers of Ltg/NZO.5.3N/N (n = 10) and Ltg/NZO.5.3N/B (n = 11) mice after 16 h fasting. Quantification also includes data of Fig. S12. Data are expressed as fold of control (N/N), analyzed by unpaired t test with Welch's correction and presented as mean ± SD. ***p <0.001. AAV, adeno-associated virus; Ltg/NZO, liver triglycerides from New Zealand obese alleles; miR, microRNA; siRNA, small interfering RNA.

