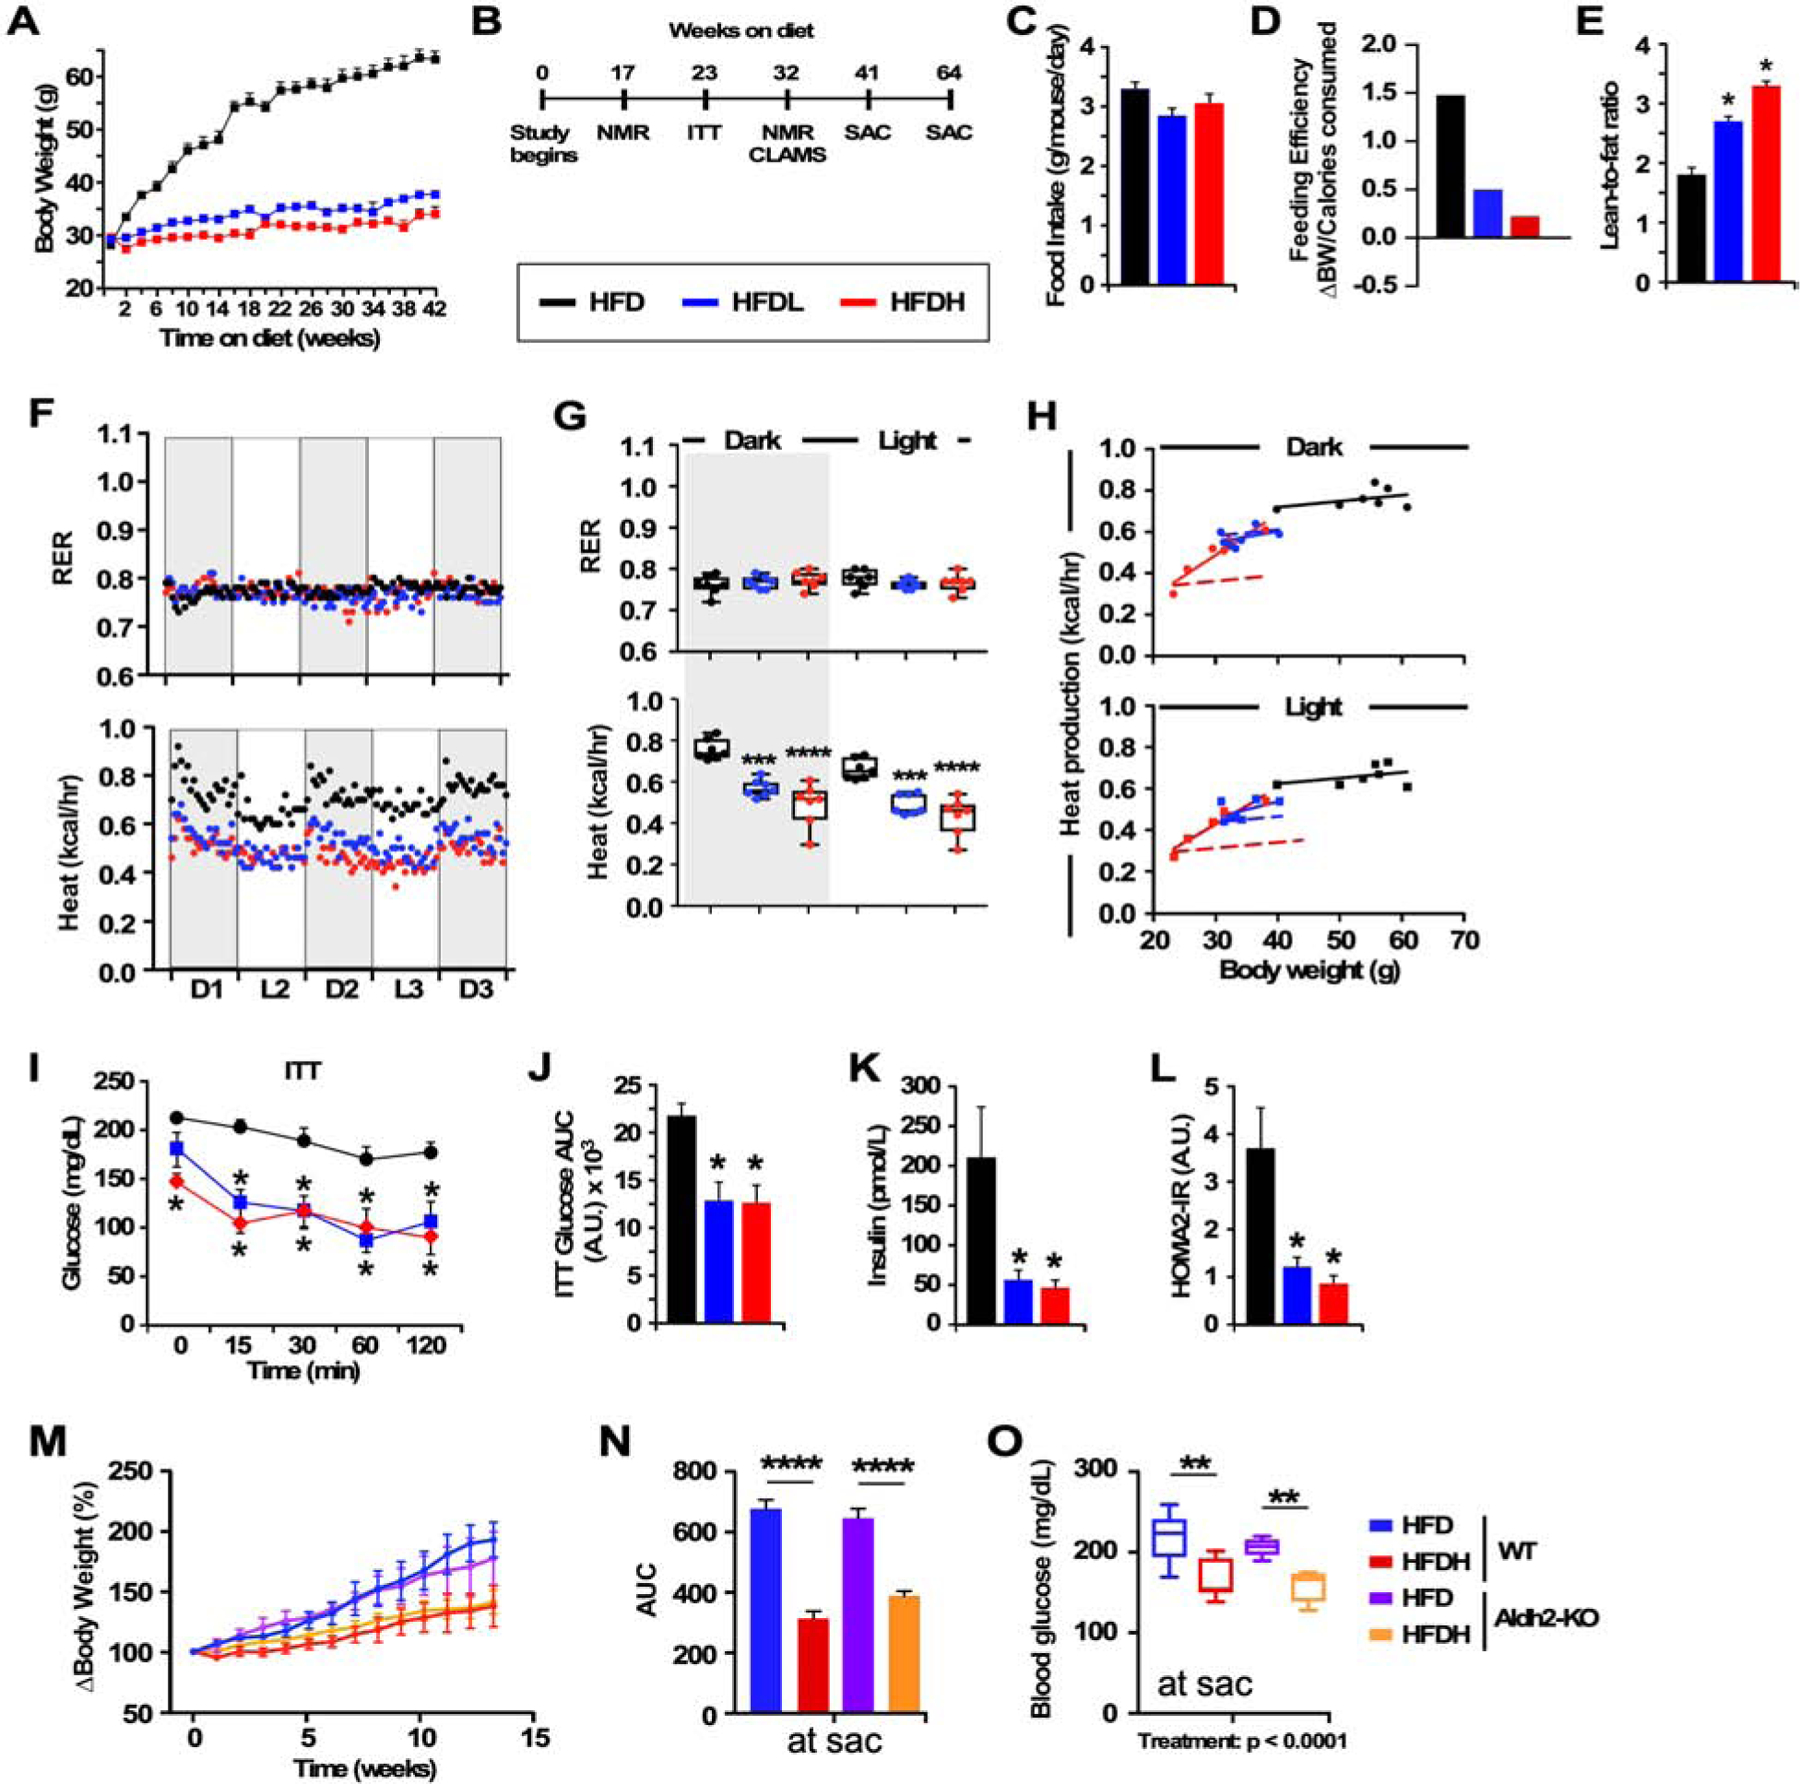
Figure 1.

DSF improves health and insulin responsiveness in mice fed a high-fat diet (HFD).
(A) Average body weight trajectory in HFD-fed mice supplemented without or with low (HFDL) and high (HFDH) doses of DSF, n =14–22 per group.
(B) Timetable for phenotypic, metabolic and biochemical analyses.
(C) Average daily food consumption across 42 weeks.
(D) Feeding efficiency expressed as change in BW over average number of calories consumed per day.
(E) Lean-to-fat ratio measured by nuclear magnetic resonance spectroscopy.
(F) Metabolic cage analyses for the determination of the Respiratory Exchange Ratio (RER) and average heat production across 60 h. D, dark cycle; L, light cycle.
(G) Average signals associated with D1-D3 (dark) and L1-L2 (light) represented as scatter plots. *** and ****, P < 0.001 and 0.0001 vs. HFD using one-way ANOVA coupled with Dunnett’s post-hoc test.
(H) Relationship between heat production and body weight in HFD, HFDL, HFDH mice. Dotted line represents the transposition of the HFD slope to that of HFDH; 48 weeks of age, 32 weeks on diet, n = 7 per group.
(I-J) Insulin tolerance test (I) with area under the curve (AUC) (J); 39 weeks of age, 23 weeks on diet, n = 6 per group.
(K) Insulin levels after a 16-h fast.
(L) The homeostatic model assessment calculation of insulin resistance (HOMA-IR); 45 weeks of age, 23 weeks on diet, n =4–6 per group. *, P < 0.05 vs. HFD.
(M-O) Response to DSF supplementation in Aldh2-KO mice fed HFD. (M) Body weight gain trajectories over the course of 13-weeks expressed as % change over baseline with (N) AUC; mean ± SEM. (O) Fasting blood glucose collected at the time of sacrifice. WT mice fed HFD +/− DSF, n = 7/group; Aldh2-KO mice on HFD +/− DSF, n = 4–5/group. Statistics for the overall effects of treatment, genotype, and the interaction (treatment x genotype) represent the P value from a two-way ANOVA for each measurement; ** and ****, P < 0.01 and 0.0001, Tukey post-hoc test.
