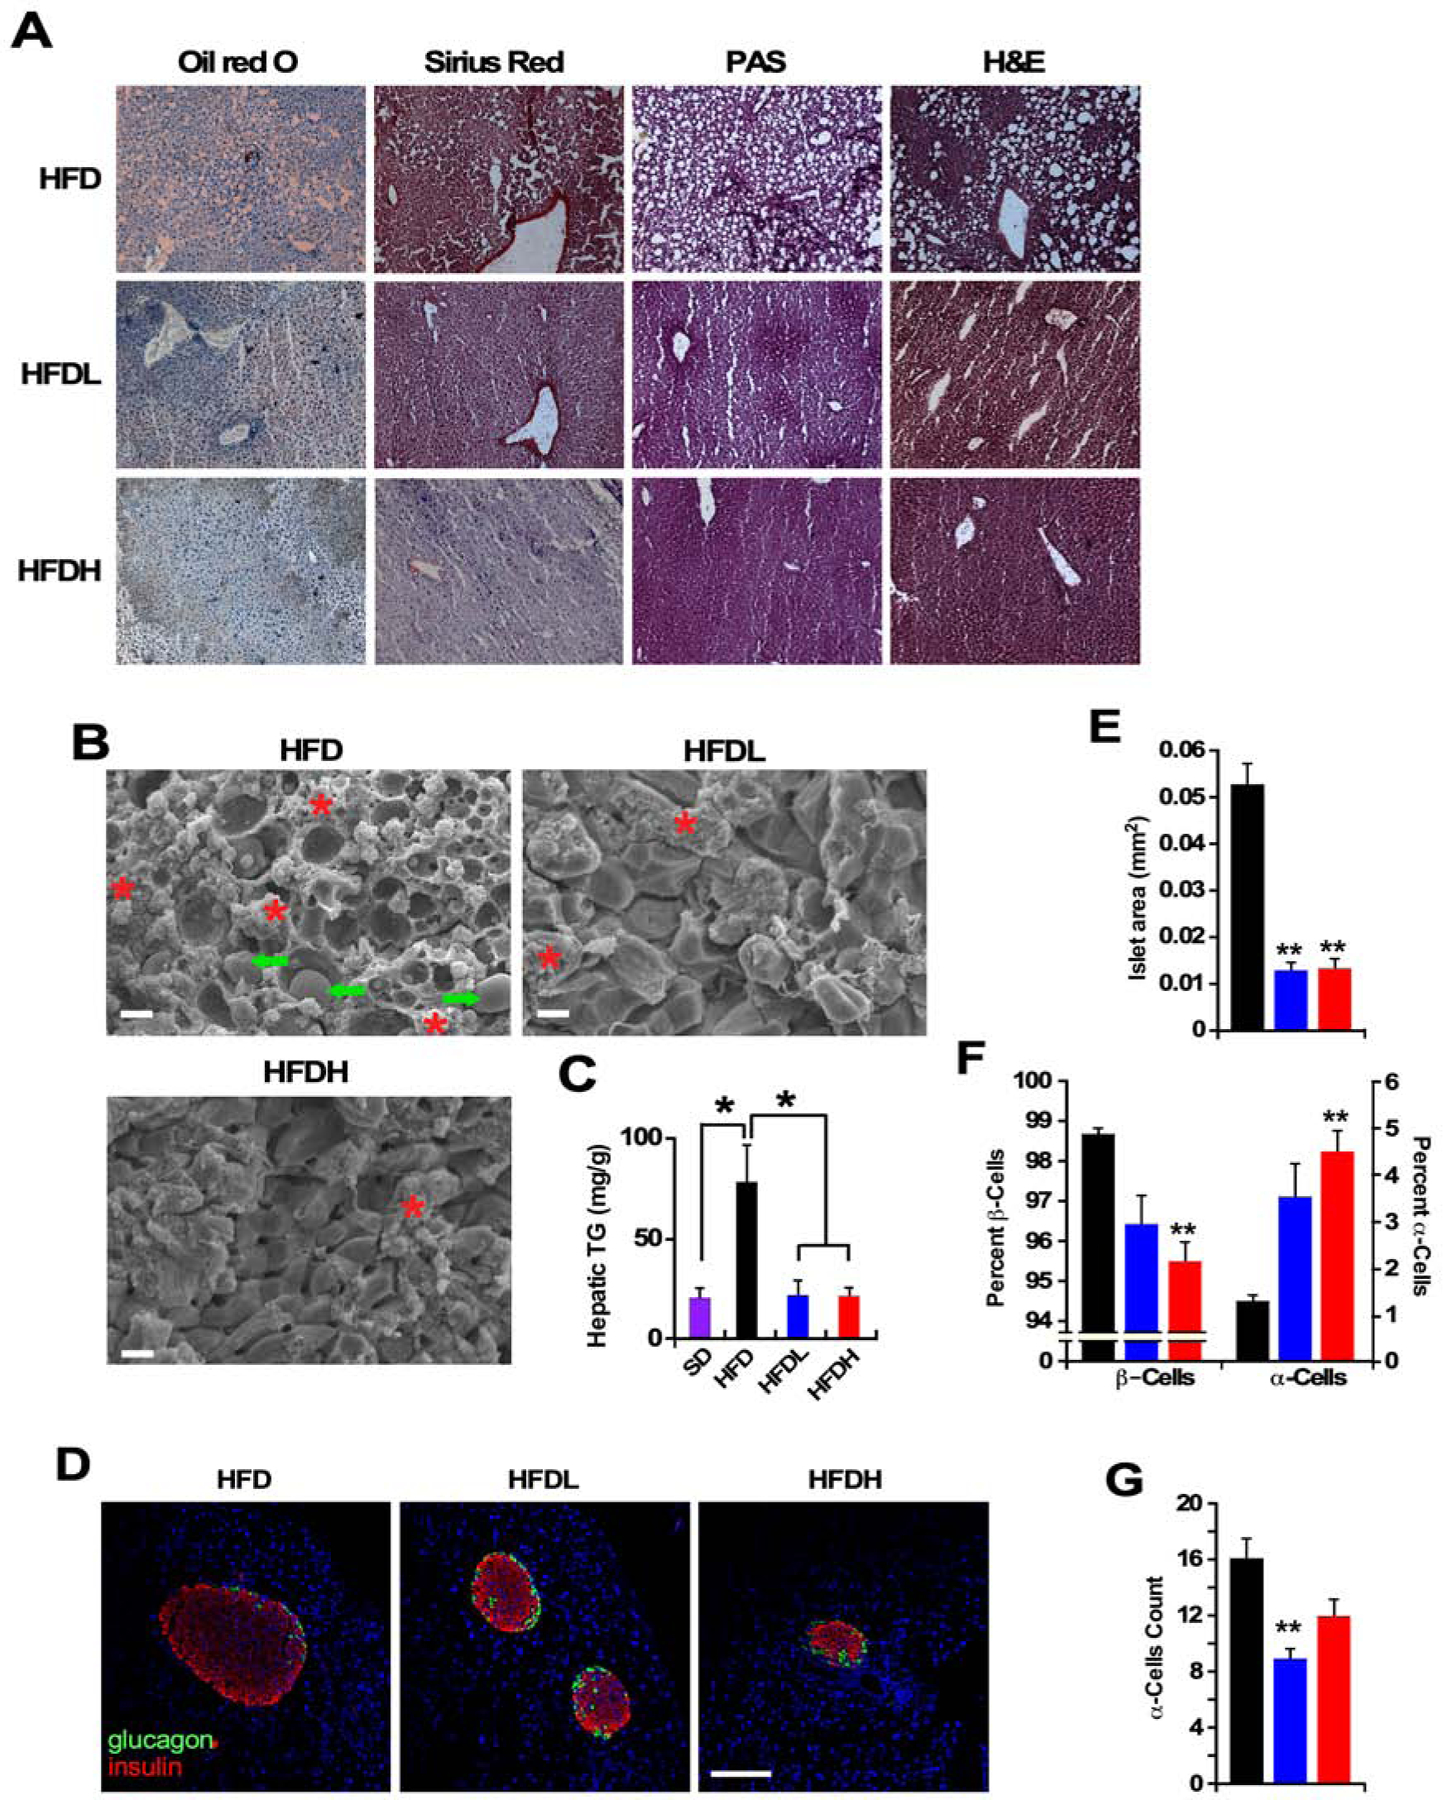
Figure 2.

Disulfiram confers protection of liver and pancreas in HFD-fed mice.
(A) Representative photomicrographs of fixed liver sections after staining with Oil red O, Sirius Red, periodic acid-Schiff (PAS), and H&E (x400). (n =5 per group. This was performed on at least 10–15 fields per slide, 3 slides/liver).
(B) Representative SEM images of fixed liver sections (x1000). Scale bar = 10 μm. Arrows denote lipid droplets and * represent hepatic stellate cells. (n = 5 per group, multiple fields per micrograph/animal).
(C) Hepatic triglyceride (TG) levels after 40 weeks on diet, n = 3–4 per group. Data are shown as mean ± SEM (n = 5 per group). * P ≤0.05 compared to diet without DSF; #, P ≤0.05 compared to low DSF.
(D) Representative images of immunostaining for insulin (red), glucagon (green), and TOPRO-3 (blue) in mouse islets after 40 weeks on the indicated dietary intervention. Scale bar = 100 μm.
(n =5 per group. This was performed on at least 10 to 15 sections separated by at least 200 μm from each other section, were assessed for signal intensity per animal).
(E) Quantification of total islet size.
(F) Percentage of β-cells (insulin positive) and α-cells (glucagon positive).
(G) Number of glucagon-producing α-cells per islet.
See also Figure S2.
