
Figure 4.
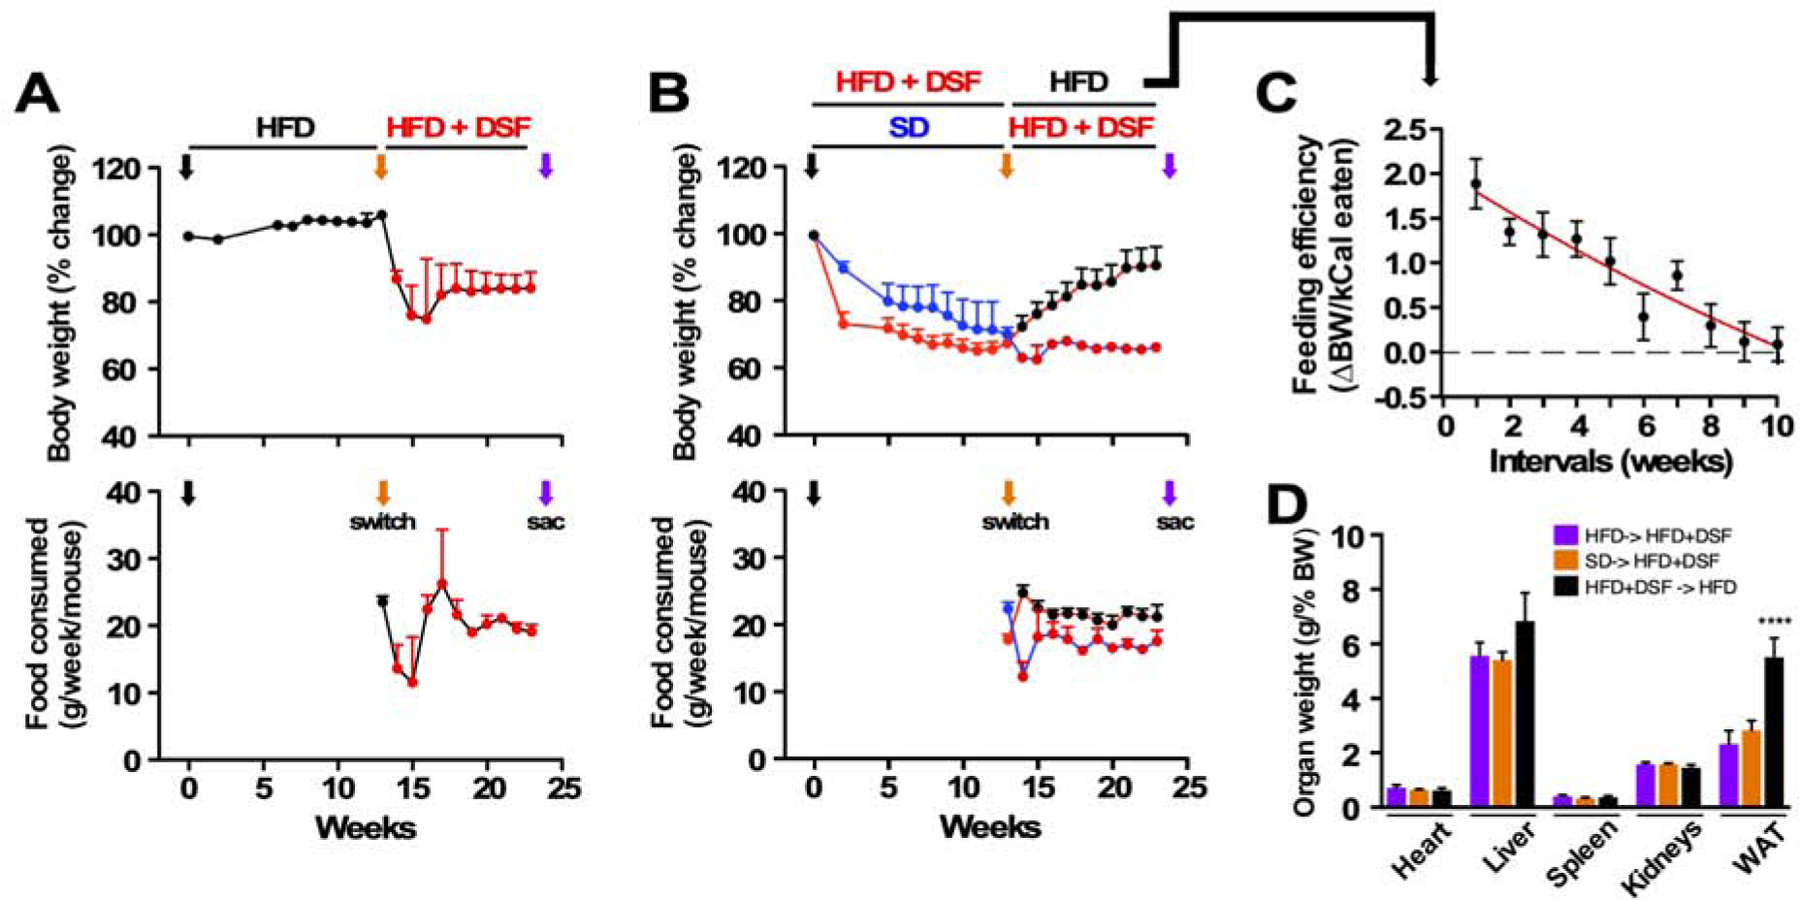
Diet switching reveals reversible actions of DSF against diet-induced metabolic dysfunction.
(A) Trajectories of body weight as percent change from baseline (upper panel) and average weekly food consumption per mouse (lower panel) fed HFD.
(B) Trajectories of body weight as percent change from baseline (upper panel) and average weekly food consumption per mouse (lower panel) fed either SD or HFD+DSF. Black arrow, diet switch from HFD to the indicated diet at the start of the experiment (t= 0); orange arrow, second diet switch; purple arrow, sac.
(C) Feeding efficiency shown by the ratio of body weight change per the number of calories ingested (n = 8, mean ± SEM).
(D) Organ weights at sac as percent of body weight (HFD-> HFD+DSF: n = 13; SD-> HFD+DSF: n = 4; HFD+DSF-> HFD: n = 8, mean ± SEM). ***, P < 0.001.