Abstract
Using an iterative structure–activity relationship driven approach, we identified a CNS-penetrant 5-(trifluoromethyl)-1,2,4-oxadiazole (TFMO, 12) with a pharmacokinetic profile suitable for probing class IIa histone deacetylase (HDAC) inhibition in vivo. Given the lack of understanding of endogenous class IIa HDAC substrates, we developed a surrogate readout to measure compound effects in vivo, by exploiting the >100-fold selectivity compound 12 exhibits over class I/IIb HDACs. We achieved adequate brain exposure with compound 12 in mice to estimate a class I/IIb deacetylation EC50, using class I substrate H4K12 acetylation and global acetylation levels as a pharmacodynamic readout. We observed excellent correlation between the compound 12 in vivo pharmacodynamic response and in vitro class I/IIb cellular activity. Applying the same relationship to class IIa HDAC inhibition, we estimated the compound 12 dose required to inhibit class IIa HDAC activity, for use in preclinical models of Huntington’s disease.
Keywords: Class IIa HDAC inhibitors, trifluoromethyloxadiazole, CNS exposure, Huntington’s disease, CHDI-00484077
The histone deacetylase (HDAC) protein family (HDACs 1–11 and class III sirtuins 1–7) is involved in transcriptional repression and chromatin condensation mechanisms, arising from the removal of acetyl groups from acetylated ε-amino groups of lysine side chains present in histones and other nonhistone proteins.1 The HDAC family is comprised of 11 zinc-dependent enzymes grouped into three classes (classes I, II, and IV). Class I enzymes (HDACs 1–3, 8) are structurally differentiated from the class II subfamily and are considered “prototypical”, in that they exhibit efficient deacetylase activity. HDAC8 has atypical catalytic activity, resembling class IIa enzymes in substrate recognition.1 Class II HDACs can be further subdivided into class IIa (HDACs 4, 5, 7, and 9) and class IIb (HDACs 6 and 10), with the latter exhibiting catalytic deacetylation comparable to that of class I enzymes. Compared to class I HDACs, the catalytic deacetylation activity of class IIa enzymes is intrinsically much weaker (∼1000-fold lower).2 No natural substrate of class IIa enzymes has been conclusively identified that can be ascribed purely to their catalytic activity rather than to their class I/III HDAC binding partners.2−4 This questions the class IIa HDACs’ bona fide deacetylase activity; the “catalytic domain” may serve instead as a recognition domain for binding to N-ε-acetyl lysine residues of proteins to orchestrate protein–protein interactions and macromolecular protein signaling.5,6 Class IIa HDACs have been implicated in numerous diseases, but of interest to our group is the role they play in Huntington’s disease (HD). Broad-spectrum/Class I/IIb HDAC inhibitors are reported to partially improve HD model phenotypes,7−10 but in some instances beneficial effects are offset by toxicity following chronic dosing paradigms.9 Our interest in selectively targeting Class IIa HDACs arose from a report that HDAC4 genetic suppression in the R6/2 mouse model of HD leads to amelioration of neurological phenotypes and extended lifespan,11 although the underlying mechanism for this improvement was unclear, given the presumed independence on deacetylase activity and the predominant cytoplasmic HDAC4 localization in the brain.12 To date, this beneficial effect appears selective to HDAC4 knockdown, as the use of genetic suppression to query involvement of some other HDAC enzymes (HDAC3, HDAC6, or the Class IIa HDAC7) has shown neither beneficial nor detrimental effects in HD mouse models.13−15 Replication of beneficial effects in HD via occupancy of the class IIa HDAC4 catalytic domain would provide confidence for small molecule intervention in treating the human disease. Here, we have focused on the identification of brain-penetrant small molecules targeting HDAC4 as a representative isoform of the class IIa subfamily.
Class I and II HDAC inhibitors can be grouped into distinct structural classes, including hydroxamic acids, carboxylic acids, benzamides, electrophilic ketones, and cyclic peptides.16 Hydroxamic acids arguably represent the most studied structural class of HDAC inhibitors, with three of four FDA-approved (anticancer) HDAC inhibitors containing this chemotype (Vorinostat, Belinostat, and Panobinostat) and the fourth (Romidepsin) being a natural product.
Previously, we reported our research efforts toward hydroxamic acid-based HDAC4 inhibitors including benzhydryl analogues and novel cyclopropanes.17−19 The bidentate interaction formed between the hydroxamic acid and the active site zinc is critical from a potency standpoint; however, rapid clearance arising from glucuronidation and hydrolysis, coupled with low oral bioavailability, is an issue that needed to be addressed in order to achieve adequate exposure in vivo.20
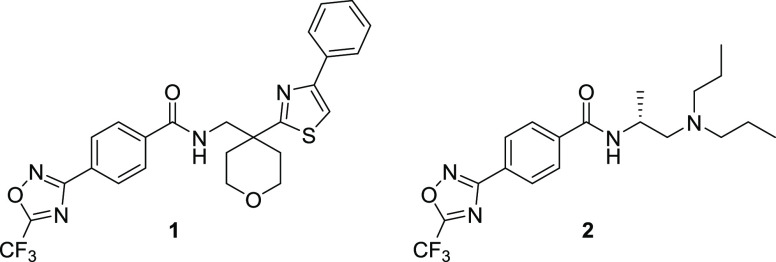
Toward this goal, we were intrigued by reports of novel 5-(trifluoromethyl)-1,2,4-oxadiazole (TFMO) moieties for targeting class IIa HDACs.21,22 The TFMO ring system in compound 1 (Figure 1) was postulated to adopt a nonchelating interaction with the active-site zinc, providing distinct structural differentiation from hydroxamic acid-based HDAC inhibitors.21 For targeting the central nervous system (CNS), we anticipated that removal of two H-bond donors present in the hydroxamic acid moiety would be beneficial for physicochemical properties required for brain penetration and provide compounds with superior pharmacokinetics.23 Herein, we describe our efforts to develop a series of TFMO-based class IIa HDAC inhibitors and identify a molecule with a suitable PK profile for evaluation in efficacy and proof-of-concept studies in disease models where deregulation of class IIa HDAC biology has been implicated.
Figure 1.
Examples of HDAC inhibitors containing the TFMO group.
TFMO-containing benzamides such as 1 and 2 have been reported (Figure 1).24 We profiled compound 2 and confirmed it was a potent HDAC4 inhibitor with good selectivity over class I/IIb HDAC isoforms, exhibiting 150-fold selectivity for class IIa over class I/IIb HDACs in cells (IC50 value of 0.02 μM vs 3.0 μM) (Table 1). The HDAC biochemical and Jurkat E6.1 cell assays used to profile compound 2 have been described previously,25 employing artificial substrates Boc-Lys-(TFA)-AMC (class IIa/HDAC8-specific) and Boc-Lys-(Ac)-AMC (class I/IIb-specific); also see Supporting Information (SI). 2 also demonstrates high kinetic solubility, negligible P-gp efflux, high permeability, but poor metabolic stability in mouse liver microsomes (Table 1).
Table 1. Compounds 2 and 7 HDAC Isoform Biochemical and Cellular Activity Dataa.
| Biochemical
class IIa (catalytic domain) HDAC IC50 (μM) |
Biochemical
class I HDAC IC50 (μM) |
Class IIb HDAC IC50 (μM) | Cellular
HDAC activity Lys (substrate)d IC50 (μM) |
MDCK-MDR1f |
|||||||||||
|---|---|---|---|---|---|---|---|---|---|---|---|---|---|---|---|
| Cpd | 4 | 5 | 7 | 9 | 1 | 2 | 3b | 8 | 6c | TFA | Ac | MLM Clint (mL/min/kg)e | EER | Papp (nm/s) | Kinetic solubility (μM) |
| 2 | 0.003 | 0.01 | 0.01 | 0.01 | 6.0 | 9.3 | 2.5 | 2.9 | 6.4 | 0.02 | 3.0 | 834 | 1.3 | 541 | 140 |
| 7 | 0.03 | 0.09 | 0.14 | 0.07 | 13 | 26 | 5.1 | 2.8 | 9.8 | 0.25 | 3.7 | 76 | 1.2 | 604 | 169 |
Geometric mean of three experiments as described previously;25 standard deviations are <25% of the mean.
HDAC3-NCoR1.
Determined utilizing HDAC6 overexpression in HEK cell lysate (Supporting Information). Assay–substrate combinations are described in SI Table 4, Supporting Information.
TFA: the Boc-Lys-(TFA)-AMC substrate is specific to class IIa HDACs and HDAC8, with the majority of class IIa HDAC activity in the Jurkat E6.1 cell line derived from HDAC4.19 Ac: the Boc-Lys-(Ac)-AMC substrate is specific to class I/IIb HDACs.
Intrinsic clearance (Clint) values of >257 mL/min/kg in mouse liver microsomes (MLM) indicate a rapid rate of oxidative metabolism by CYP450 enzymes under the assay conditions. A Clint value of <65 mL/min/kg indicates a low rate of metabolism.
EER is defined as the efflux ratio in MDCK-MDR1 cells/efflux ratio in MDCK wild-type cells with the efflux ratio being Papp(B to A)/Papp(A to B).
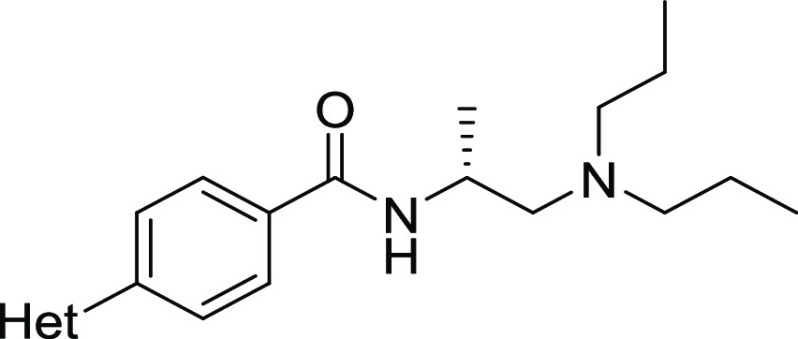
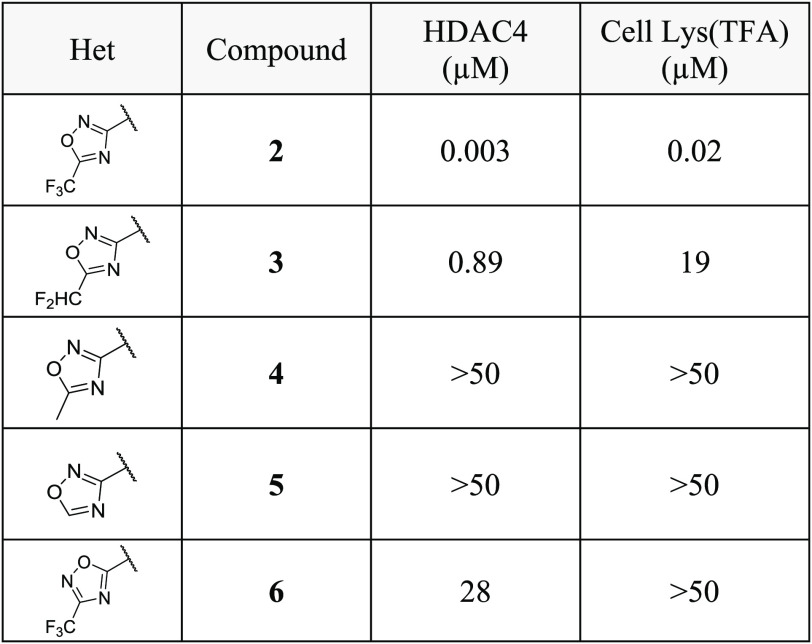
Surface plasmon resonance (SPR) experiments confirmed binding of compound 2 to immobilized HDAC4 catalytic domain with a KD(ss) of 0.044 μM and a short residence time (tR) of 2.5 min (SI Table 1). To assess the importance of the TFMO moiety for HDAC4 inhibition, close analogues (3–6) were synthesized (Table 2). Replacement of the CF3 group in 2 with CHF2 (3) lead to a 300-fold decrease in HDAC4 potency. Introduction of a methyl group or hydrogen atom onto the oxadiazole ring (4 and 5) led to complete loss of HDAC4 activity. Furthermore, the regioisomeric oxadiazole 6 exhibited 4 orders of magnitude loss of HDAC4 potency. These data demonstrate not only that the CF3 group is required for class IIa HDAC cellular potency but also that the position of the oxygen atom in the 1,2,4-oxadiazole regioisomer is crucial for achieving adequate biochemical and cellular activity.
Table 2. TFMO Ring Modifications and the Effect on Class IIa Biochemical and Cellular Activity.
The highly electron-deficient TFMO ring has been reported to behave as a 1,3-dielectrophilic substrate susceptible to nucleophilic attack.26 In order to assess the chemical stability of this zinc-binding moiety in solution, compound 2 was dissolved in DMSO-d6 and monitored by 1H NMR spectroscopy over 9 days at room temperature, with no apparent degradation observed after this time.
To address the poor metabolic stability observed for compound 2, we focused our efforts on modifications to the lipophilic basic amine region; a potential site for oxidative metabolism. Introduction of a terminal pyrrolidine group24 (7) reduced overall lipophilicity (AlogP = 4.0 for 2 vs AlogP = 2.4 for 7) and resulted in improved mouse metabolic stability (Clint = 76 mL/min/kg body weight) over the acyclic amine 2 (Table 1). Although reduced class IIa cell activity (IC50 0.25 μM) and diminished (15-fold) cellular selectivity over HDAC class I/IIb were observed for 7, its increased metabolic stability became a key driver for future inhibitor optimization.
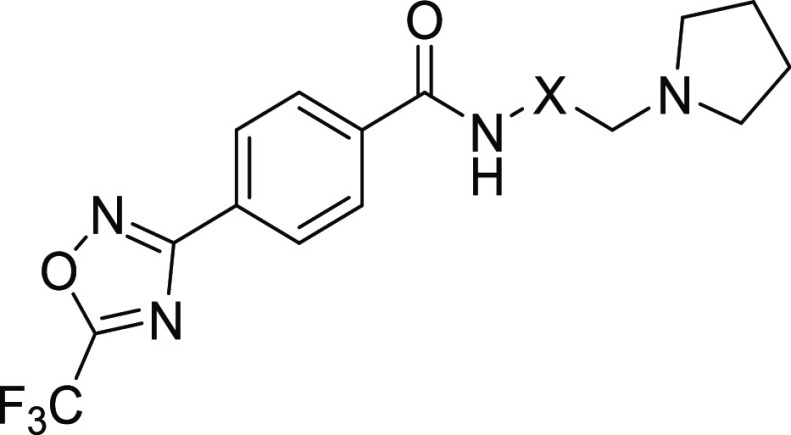
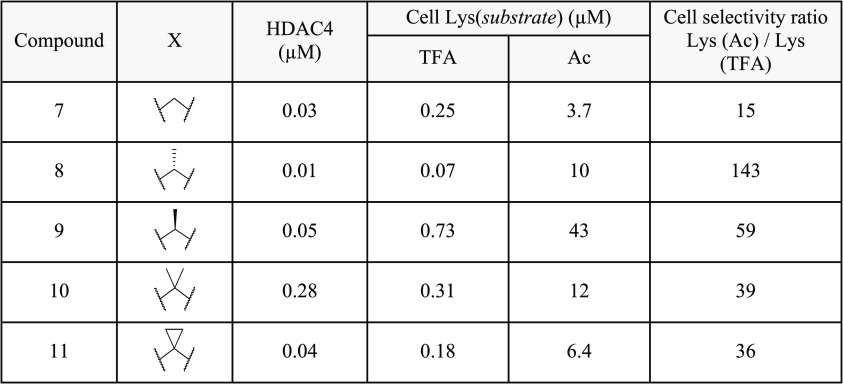
To further investigate the SAR in 7, several substituted amino linker analogues were synthesized (Table 3). Class IIa HDAC potency and selectivity over class I/IIb HDACs was improved by incorporation of an (R)-methyl substituent in the aliphatic linker; 8 exhibited a 3-fold improvement in HDAC4 biochemical and cellular potency over 7, with improved cellular selectivity for class IIa over class I/IIb HDACs (cell ratio = 143-fold); the (S)-enantiomer 9 was 10-fold less active than 8 in the class IIa HDAC cell assay. Substitution of the linker with a gem-dimethyl (10) or cyclopropyl (11) also reduced HDAC class IIa cellular selectivity compared to 8.
Table 3. Linker Modifications and the Effect on Potency and Selectivity.
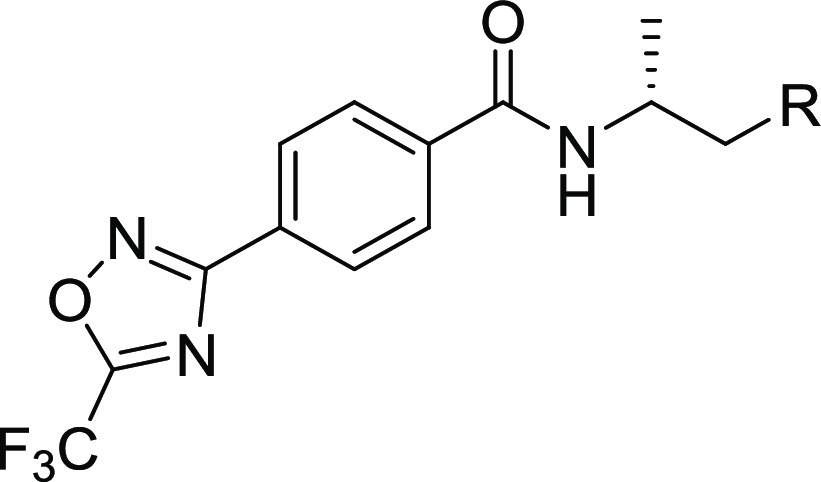
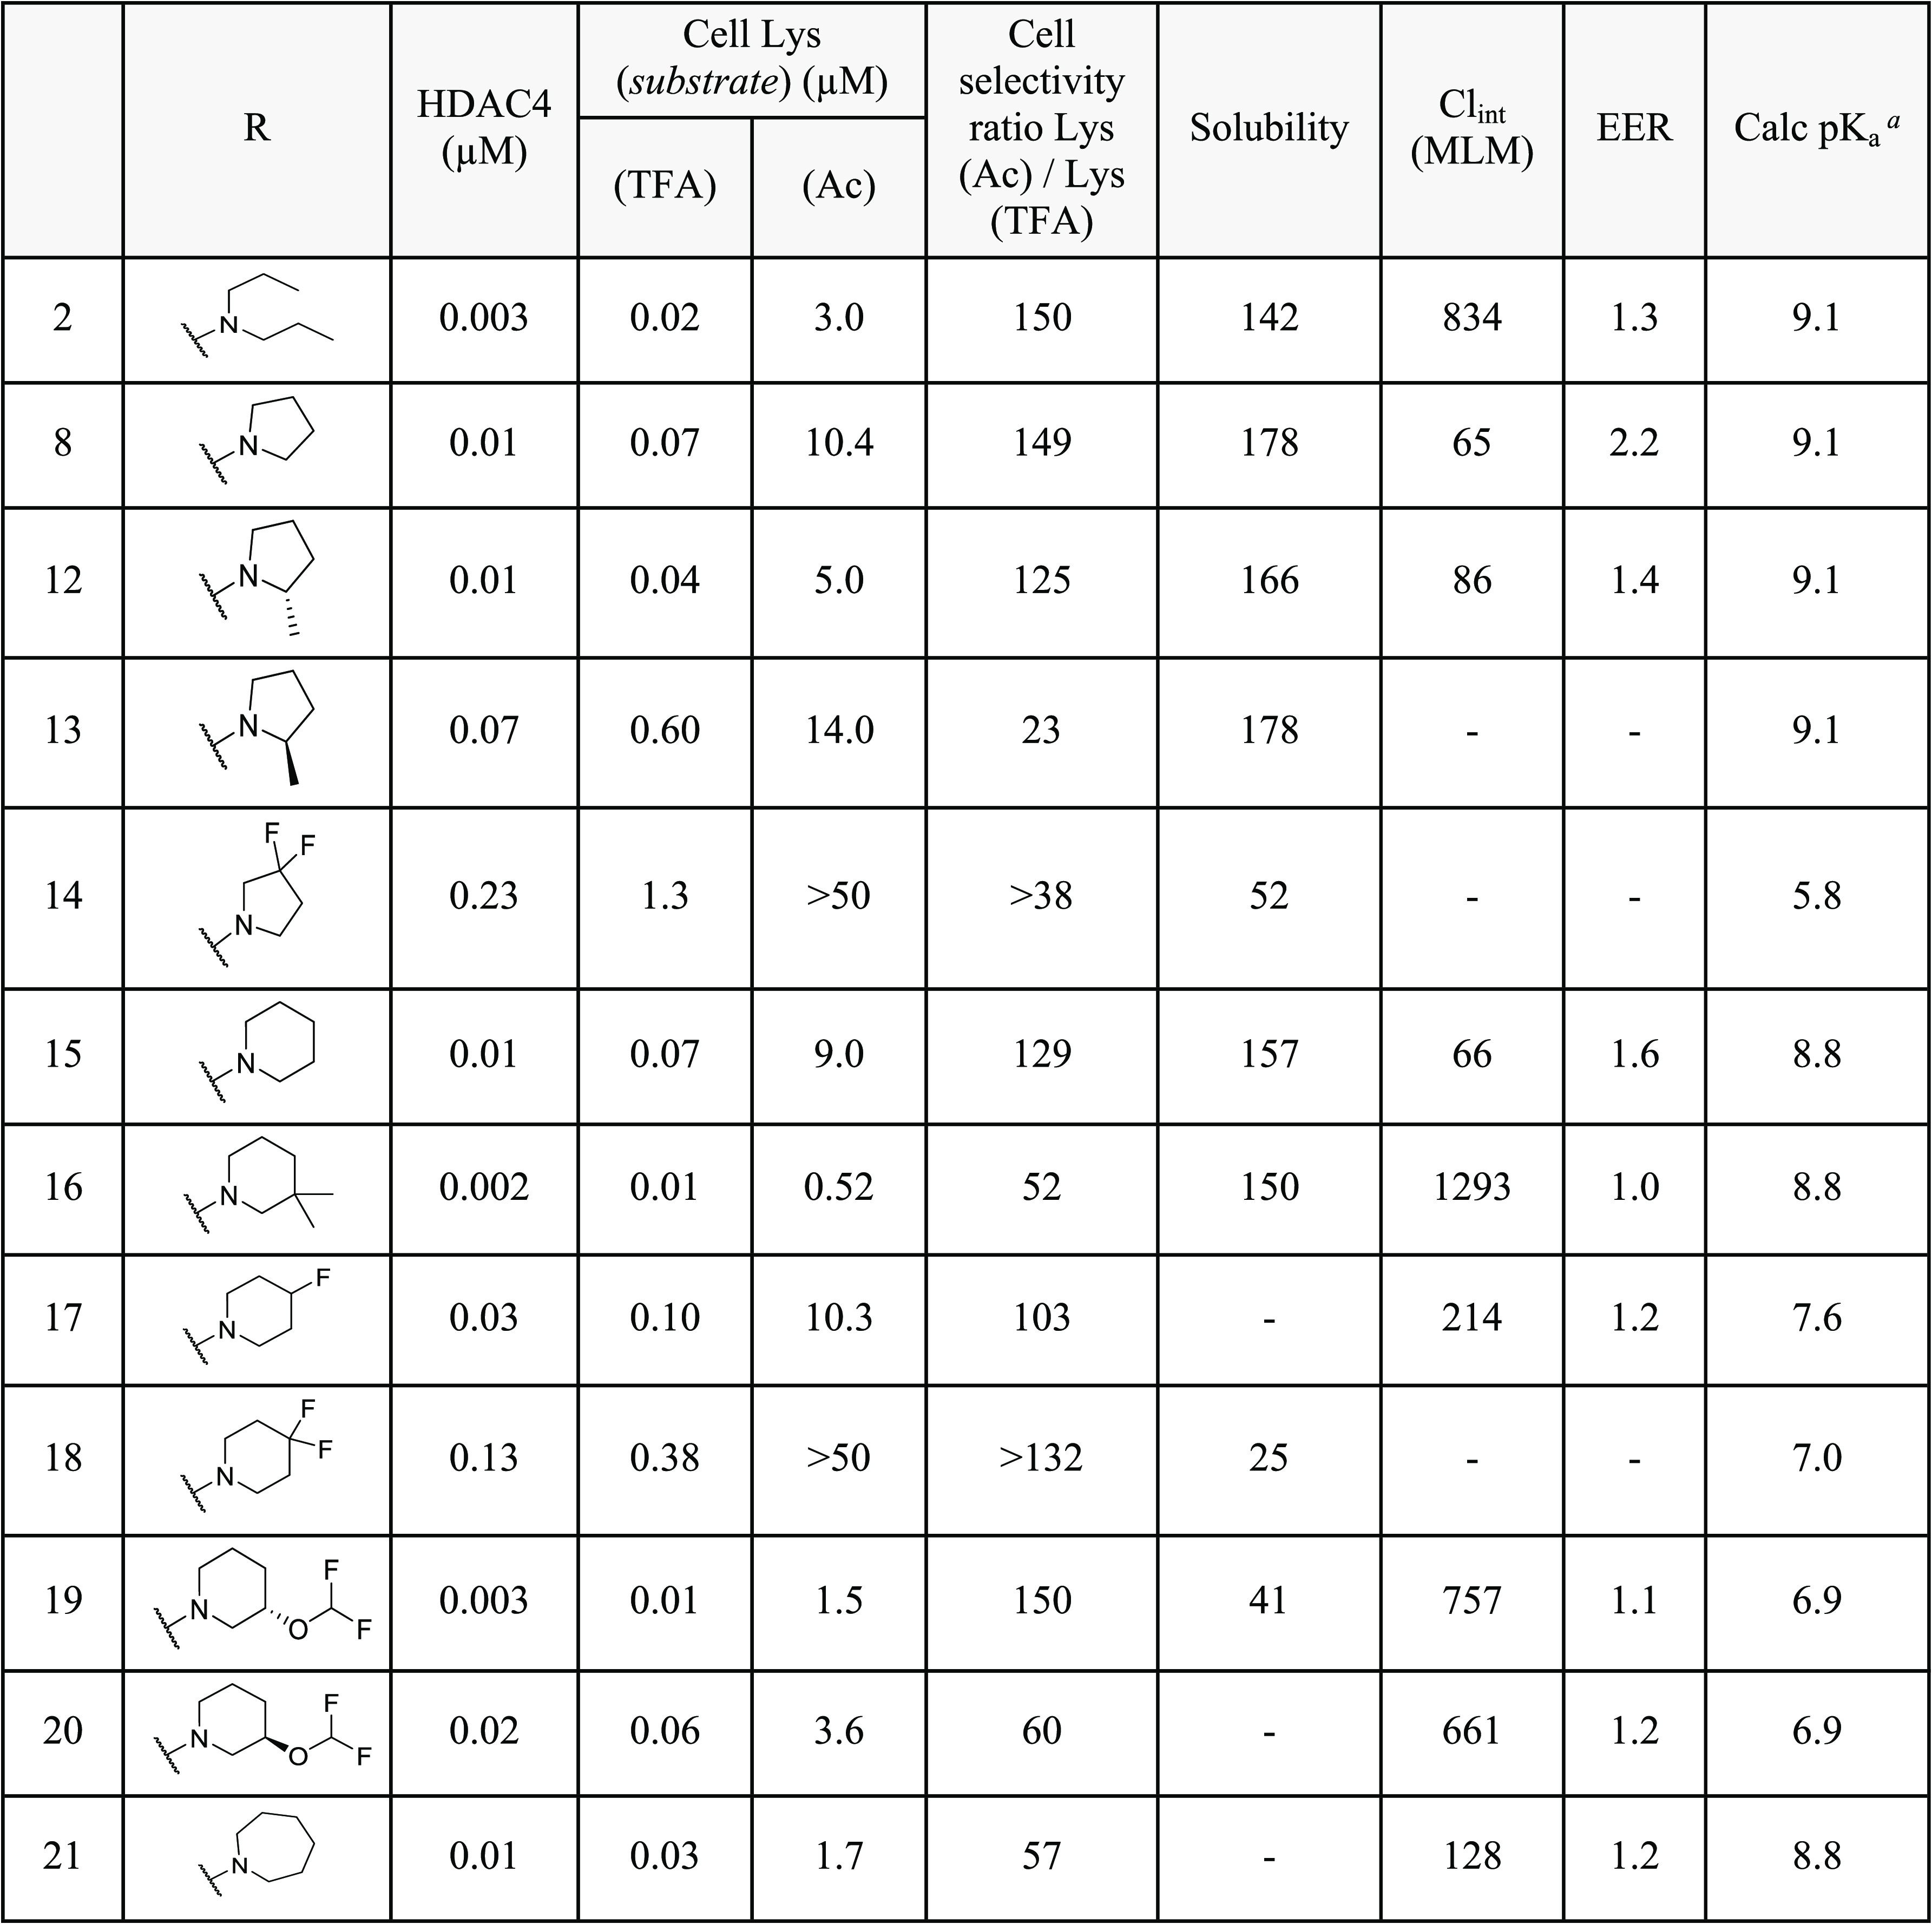
Toward exploiting 8’s superior class IIa HDAC cellular potency and selectivity, we focused efforts on modifications to the terminal pyrrolidine ring (Table 4). We previously disclosed X-ray structures of hydroxamic acid-based ligands in complex with HDAC4, showing an aspartate residue (Asp759) in close proximity to the ligand.18,19 The terminal basic amines exemplified in Table 4 are likely to occupy this region of the binding cavity and form a salt bridge interaction with Asp759. Pyrrolidine, piperidine, and azepane derivatives (8, 15, and 21) all demonstrate potent HDAC4 inhibition and improved metabolic stability when compared to acyclic analogue 2, and with respect to basicity, cyclic amines covering a range of pKa values (6.9–9.1) are able to achieve very potent HDAC4 inhibition. Finally, as demonstrated by diastereomeric pairs 12 vs 13 and 19 vs 20, the absolute stereochemistry of the substituent on the pyrrolidine and piperidine rings respectively has a significant effect on HDAC potency.
Table 4. Terminal Amine Modifications and the Effect on Potency and ADME Properties.
pKa values calculated using ACD Laboratories Percepta Portal, Client Version 1.7.2.
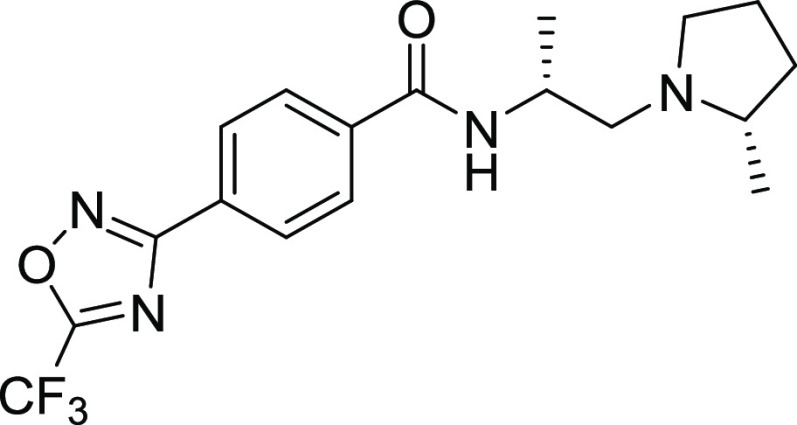
We sought to identify compounds with ≥100-fold selectivity for class IIa versus class I/IIb HDACs. Based on its optimal potency, selectivity, and encouraging ADME profile, 12 was progressed to further biochemical and cellular selectivity assessment and mouse PK studies.
Additional profiling in HEK293 cells (Supporting Information) revealed potent class IIa inhibition (0.01 μM) and excellent selectivity against class I and class IIb HDACs (990-fold and >2900-fold, respectively). To assess broader selectivity and gain insight into potential cardiac liability, 12 was profiled against a panel of binding, cellular and nuclear receptor functional and enzymatic assays (Cerep, France). 12 exhibited >80% inhibition at 10 μM single concentration against HDAC4 and muscarinic M1-M5 receptors and 50–80% inhibition for σ1, L-type calcium (diltiazem site) and sodium channels (SI Table 2). In separate assays, Kd values for M1–M4 were determined to be >5 μM, and the Kd value for hERG was 3.9 μM (IonWorks) (SI Table 3). No cytochrome P450 inhibition was observed in human liver microsomes for any of the tested isoforms (1A2, 2C8, 2C9, 2C19, 2D6, 3A4, all IC50 values >50 μM) (Supporting Information).
12 was stable in mouse and human plasma and blood and simulated gastric fluid (SI Figure 1 and 2). It preferentially distributed into mouse blood versus plasma (ratio 3:1) and displayed an unbound fraction (Fu) of 0.73 in blood, determined by equilibrium dialysis. Fu of 12 in mouse brain homogenate was 0.17, higher than previous hydroxamic acid-based compounds tested in our hands, which were typically in the range 0.026–0.0041.18,19
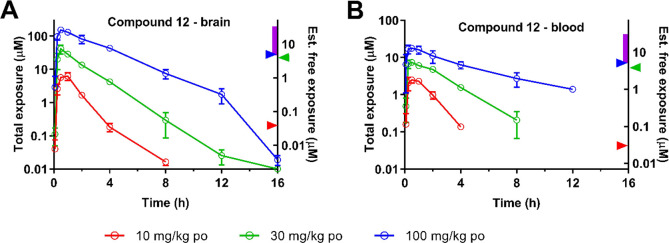
In PK studies, 12 was dosed intravenously (3.3 mg/kg) and via oral gavage (11.5 mg/kg) to fed male C57Bl/6 mice (PK parameters shown in SI Table 5) and demonstrated 100% oral bioavailability, high volume of distribution (3.8 L/kg), high distribution to brain (brain to blood exposure ratio up to 3; SI Table 6), and high plasma clearance (4.2 L/h/kg). In oral dose escalation studies (Figure 2), 12 was absorbed rapidly with a Tmax of 0.5 h in blood and brain. An approximate linear increase in Cmax and AUC was seen in blood across the dose range investigated; however, a supra-proportional increase in Cmax and AUC was seen in brain and muscle (SI Table 7). As 12 has moderate to high % unbound in blood, we speculated that blood binding may be saturated at higher doses resulting in increased free compound available to cross into the brain, explaining the supraproportional increase in brain concentrations. Indeed, brain to blood ratios increased with increasing dose with mean values ranging from 1.3–2.7 (10 mg/kg), 1.4–5.6 (30 mg/kg), and 1.2–8.7 (100 mg/kg) over the 0.25 to 12 h following administration. All doses achieved total brain exposures above the on-target class IIa cellular IC50 for ∼4, 8, and 14 h, respectively, for the 10, 30, and 100 mg/kg doses, whereas only the 30 and 100 mg/kg doses achieved significant brain exposure predicted to engage off-target class I/IIb cellular IC50 for ∼2 and 6 h, respectively.
Figure 2.
Brain (A) and blood (B) exposure of 12 following oral gavage of compounds to C57/BL6 mice (10, 30, and 100 mg/kg). Left Y axis indicates the measured exposure in the matrix (determined by LC-MS/MS). Right Y axis indicates estimated free exposure, scaled based on fu values returned in each matrix in vitro. Class IIa cellular IC50 is shown by the red arrowhead; class I/IIb cellular IC50 is shown by the blue arrowhead. Affinity measures for other binding targets identified by the Cerep Diversity panel (KD range for M1–M4 receptors) indicated by the purple bar, and KD for HERG channels (IonWorks) indicated by the green arrowhead (SI Table 3).
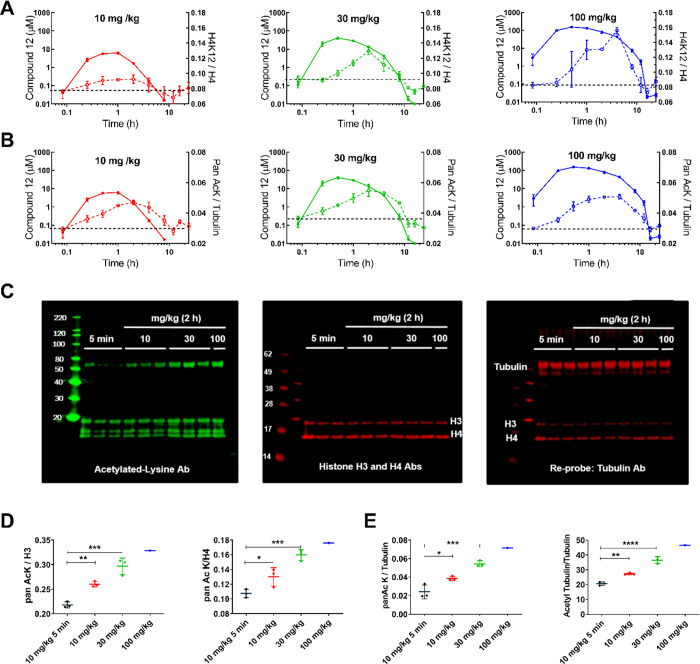
Consistent with the lack of precedent for endogenous class IIa HDAC substrates4 and diminished deacetylase activity observed for this HDAC subfamily, we were unable to identify a specific class IIa biomarker to directly study compound effects for selective class IIa deacetylase activity in vivo. However, as 12 displays off-target class I/IIb inhibition at high concentration in vitro (Jurkat cell IC50 = 5 μM) (Table 5) and exhibits brain exposure sufficient to inhibit class I/IIb enzymes at higher doses administered (Figure 2), studies assessing class I/IIb substrate acetylation were undertaken in the brain samples from these mice. Specific acetylation of histone H4K12 (deacetylated by class I HDACs) or an increase in global acetylation, measured using a pan antiacetylation antibody, was quantified by the dot blot technique (Supporting Information) (Figure 3). Acetylated H4K12 levels were normalized to total H4 levels (Figure 3A), and pan-acetylation levels were normalized to tubulin (Figure 3B). H4K12 acetylation, reflective of class I HDAC activity, increased dose-dependently. Global acetylation increase (reflective of both class I and IIb HDAC activity) showed somewhat greater acetylation at lower exposures when compared to H4K12 acetylation (Figure 3B, 10 mg/kg dose). In general, the maximum effect on either H4K12 or pan-acetylation lagged behind that of maximal compound exposure; compound tmax was observed at ∼0.5 h, while maximal pan-acetyl lysine intensity was observed at 2 h, and maximal acetylated H4K12 intensity was observed between 2 and 4 h. Acetylation of specific substrates in these samples was confirmed by Western blot assessment from 2 h postdose samples (Figure 3C). Acetylation of histones H3, H4, and tubulin was quantified by normalizing to respective total protein intensity. Dose-dependent acetylation of the class I target histones H3/H4 and acetylation of the class IIb substrate tubulin was confirmed in all samples, dose-dependently increasing with increasing compound exposure (Figure 3D–E).
Table 5. HDAC Biochemical and Cellular Data for Compound 12a.
| Biochemical potency | |||||||||
|---|---|---|---|---|---|---|---|---|---|
| Subfamily | Class
IIa |
Class
I |
Class IIb | ||||||
| HDACn | 4 | 5 | 7 | 9 | 1 | 2 | 3 | 8 | 6 |
| IC50 (μM)a | 0.01 | 0.02 | 0.02 | 0.03 | 17 | 27 | 10 | 2.0 | 22 |
| Cellular potency | |||||
|---|---|---|---|---|---|
| Subfamily | Class
IIa |
Class I | Class IIb | Class I and IIb | |
| Cell type | Jurkat | HEK293 | HEK293 | HEK293 | Jurkat |
| IC50 (μM)a | 0.04 | 0.01 | 9.9 | >29 | 5.0 |
Figure 3.
(A–B) Correlation of HDAC class I/IIb substrate acetylation (broken line) to 12 brain exposure (continuous line). Left axis: concentration of 12 measured by LC-MS/MS in brain (solid line). Right axis: H4K12 normalized to H4 histone levels (broken line) (A) or Pan AcK normalized to tubulin (B) measured via dot blot assay from brain samples. Increasing doses of 12 administered p.o. resulted in increasing “off-target” class I H4K12 acetylation (A) and increasing global acetylation levels (B). (C–D) To confirm specific class I/IIb substrate acetylation, samples from the 2 h time point were probed by Western blot to determine H3, H4, and tubulin acetylation and compared to the 5 min 10 mg/kg samples (C). (D) Quantitation of the pan-AcK band corresponding to H3 (left) and H4 (right) normalized to H3 and H4 total protein band intensity. (E). Quantitation of the pan-AcK band corresponding to tubulin molecular weight normalized to total tubulin protein band intensity (left). Quantitation of tubulin acetylation was equivalent when an Ab specific for acetylated tubulin was used (right). One-way ANOVA with Dunnett’s multiple comparison test: p < 0.05*, p < 0.01**, p < 0.001***, p < 0.0001****.
We next examined the tolerability of 12 in the R6/2 mouse model of HD alongside wild-type litter-mate controls. 12 was stable in vehicle (10% [w/v] hydroxypropyl-β-cyclodextrin in 50 mM citrate buffer) over a 30-day period (SI Table 8). Mice were dosed orally b.i.d. with 12 at 10, 30, or 100 mg/kg or vehicle for 14.5 days, with collection of blood and brain samples 2 h post final dose. 12 was well-tolerated over this period with no adverse effects observed on body weight, body temperature, or scores to passive observations or active manipulations of the mice (SI Table 9). Concentrations of 12 in blood and brain were similar in wild-type and R6/2 mice (male and female) at each dose level. In addition to bioanalytical determination of 12 in brain, half-brain samples from dosed mice were also assessed for acetylation signatures using the dot blot technique, and acetylation of the specific class I substrates H3 and H4 and the class IIb substrate tubulin in these samples was subsequently assessed by Western blot (Supporting Information).
In agreement with acute dosing, global acetylation signatures using the dot blot technique increased in response to treatment with 12 for oral doses ≥10 mg/kg, while H4K12 acetylation was increased for 30 and 100 mg/kg oral doses (data pooled for wild-type and R6/2 mice) (SI Figure 3A). The estimated acetylation EC50 in brain for global acetylation (likely reflective of both class I and IIb protein substrates) was 20 μM total exposure (or 3.5 μM estimated free exposure based on a Fu value of 0.17) (SI Figure 3B–C). This EC50 was consistent with the IC50 values previously determined in HDAC class I/IIb cellular assays (IC50 5–10 μM; Table 5). Western blots were run on these samples to assess acetylation of the specific class I substrates H3 (SI Figure 3D) AND H4 (SI Figure 3E) and class IIb substrate tubulin (SI Figure 3F). In these instances, although trends for increased acetylation of H4 and tubulin were seen in the 30 mg/kg group, only significant increased acetylation was seen in the highest dose group (100 mg/kg). Overall, the similar PK:PD profile obtained here after 15 days of po bid dosing compared to acute administration confirmed the impact of 12 was largely sustained following subchronic administration.
Given the good correlation of the 12 PD response empirically determined in vivo and the class I and IIb cellular activity measured in vitro, it is reasonable to assume this relationship will also hold for occupancy of class IIa HDAC enzymes. In oral b.i.d. dosing simulations, we calculated brain concentrations of compound 12 at 3, 10, and 30 mg/kg (Figure 4). Three and 10 mg/kg b.i.d. were predicted to achieve sufficient brain exposure to effectively inhibit class IIa HDACs (above the cellular IC50 value for class IIa HDACs for ∼4–6 h post each dose respectively) with low to negligible off-target liability (<EC10 for acetylation of class I/IIb substrates).
Figure 4.
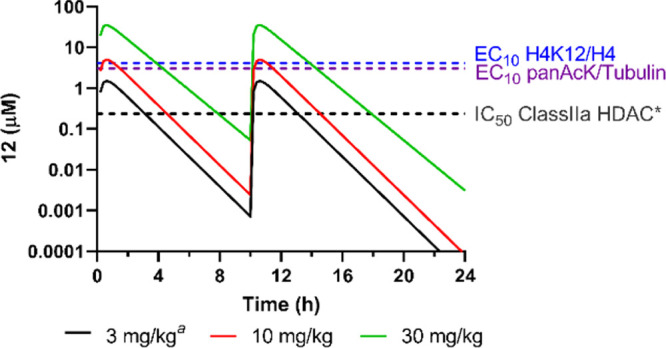
Oral bid dosing simulation (modeling a dose interval of 10 h), showing simulated total brain concentration of 12. a Estimates of final parameters from 10 mg/kg po were used to predict concentrations achieved following 3 mg/kg po. Both doses are predicted to provide brain exposure exceeding class IIa HDAC IC50 for ∼4–6 h post each dose and to have minimal effect on engaging class I/IIb HDACs, with brain exposure failing to reach concentrations > EC10 for class I/IIb substrate acetylation, as determined empirically (SI Figure 3B–C). *The in vivo class IIa IC50 (235 nM) was estimated from the measured cellular IC50 (40 nM) adjusted for 12 Fu of 0.17 in brain homogenate.
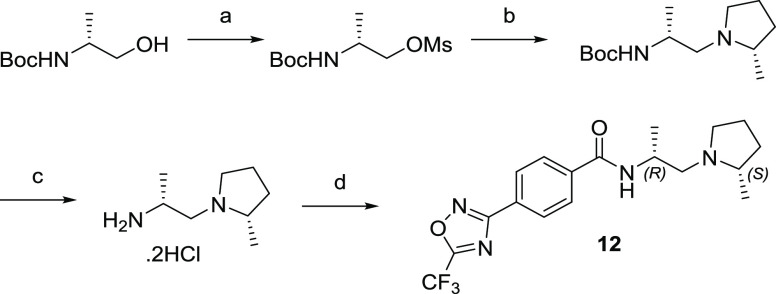
The synthesis of compound 12 is illustrated in Scheme 1.
Scheme 1. Synthesis of 12.
Reagents and conditions: (a) MsCl, Et3N, DCM, 0 °C to r.t., 18 h. (b) (S)-2-methylpyrrolidine hydrochloride, Cs2CO3, DMF, 60 °C, 17 h (35% two steps). (c) HCl, dioxane, DCM, r.t., 2 h (81%). (d) 4-(5-(Trifluoromethyl)-1,2,4-oxadiazol-3-yl)benzoic acid, EDC, HOPO, DIPEA, DCM, r.t., 17 h (97%).
In conclusion, we optimized the in vitro HDAC class IIa selectivity and metabolic stability of a series of TFMO HDAC class IIa inhibitors, leading to identification of compound 12 (CHDI-00484077), which displays PK properties and CNS exposure suitable for progression to efficacy studies in mouse models of HD. Determination of observable class I and IIb-mediated acetylation of proteins in CNS dosing simulations indicated that doses of 3 and 10 mg/kg of 12 would likely provide selective class IIa HDAC inhibition. Compound 12 offers higher unbound exposure in mouse brain over existing hydroxamic-based inhibitors previously described by this laboratory17−19 and represents a valuable compound to further probe potential class IIa HDAC-targeted therapies for HD.
Supporting Information Available
The Supporting Information is available free of charge at https://pubs.acs.org/doi/10.1021/acsmedchemlett.0c00532.
Methods, compound synthesis, and supplementary tables and figures (PDF)
The authors declare no competing financial interest.
Dedication
§ The authors dedicate this manuscript to the memory of Dr. Alexander H. Borchers, who passed away on August 3rd, 2019.
Supplementary Material
References
- Campos E. I.; Reinberg D. Histones: annotating chromatin. Annu. Rev. Genet. 2009, 43, 559–99. 10.1146/annurev.genet.032608.103928. [DOI] [PubMed] [Google Scholar]
- Jones P.; Altamura S.; De Francesco R.; Gallinari P.; Lahm A.; Neddermann P.; Rowley M.; Serafini S.; Steinkuhler C. Probing the elusive catalytic activity of vertebrate class IIa histone deacetylases. Bioorg. Med. Chem. Lett. 2008, 18 (6), 1814–9. 10.1016/j.bmcl.2008.02.025. [DOI] [PubMed] [Google Scholar]
- Lahm A.; Paolini C.; Pallaoro M.; Nardi M. C.; Jones P.; Neddermann P.; Sambucini S.; Bottomley M. J.; Lo Surdo P.; Carfi A.; Koch U.; De Francesco R.; Steinkuhler C.; Gallinari P. Unraveling the hidden catalytic activity of vertebrate class IIa histone deacetylases. Proc. Natl. Acad. Sci. U. S. A. 2007, 104 (44), 17335–40. 10.1073/pnas.0706487104. [DOI] [PMC free article] [PubMed] [Google Scholar]
- Mielcarek M.; Seredenina T.; Stokes M. P.; Osborne G. F.; Landles C.; Inuabasi L.; Franklin S. A.; Silva J. C.; Luthi-Carter R.; Beaumont V.; Bates G. P. HDAC4 does not act as a protein deacetylase in the postnatal murine brain in vivo. PLoS One 2013, 8 (11), e80849. 10.1371/journal.pone.0080849. [DOI] [PMC free article] [PubMed] [Google Scholar]
- Bradner J. E.; West N.; Grachan M. L.; Greenberg E. F.; Haggarty S. J.; Warnow T.; Mazitschek R. Chemical phylogenetics of histone deacetylases. Nat. Chem. Biol. 2010, 6 (3), 238–243. 10.1038/nchembio.313. [DOI] [PMC free article] [PubMed] [Google Scholar]
- Fischle W.; Kiermer V.; Dequiedt F.; Verdin E. The emerging role of class II histone deacetylases. Biochem. Cell Biol. 2001, 79 (3), 337–48. 10.1139/o01-116. [DOI] [PubMed] [Google Scholar]
- Ferrante R. J.; Kubilus J. K.; Lee J.; Ryu H.; Beesen A.; Zucker B.; Smith K.; Kowall N. W.; Ratan R. R.; Luthi-Carter R.; Hersch S. M. Histone deacetylase inhibition by sodium butyrate chemotherapy ameliorates the neurodegenerative phenotype in Huntington’s disease mice. J. Neurosci. 2003, 23 (28), 9418–27. 10.1523/JNEUROSCI.23-28-09418.2003. [DOI] [PMC free article] [PubMed] [Google Scholar]
- Gardian G.; Browne S. E.; Choi D. K.; Klivenyi P.; Gregorio J.; Kubilus J. K.; Ryu H.; Langley B.; Ratan R. R.; Ferrante R. J.; Beal M. F. Neuroprotective effects of phenylbutyrate in the N171–82Q transgenic mouse model of Huntington’s disease. J. Biol. Chem. 2005, 280 (1), 556–63. 10.1074/jbc.M410210200. [DOI] [PubMed] [Google Scholar]
- Hockly E.; Richon V. M.; Woodman B.; Smith D. L.; Zhou X.; Rosa E.; Sathasivam K.; Ghazi-Noori S.; Mahal A.; Lowden P. A.; Steffan J. S.; Marsh J. L.; Thompson L. M.; Lewis C. M.; Marks P. A.; Bates G. P. Suberoylanilide hydroxamic acid, a histone deacetylase inhibitor, ameliorates motor deficits in a mouse model of Huntington’s disease. Proc. Natl. Acad. Sci. U. S. A. 2003, 100 (4), 2041–6. 10.1073/pnas.0437870100. [DOI] [PMC free article] [PubMed] [Google Scholar]
- Jia H.; Pallos J.; Jacques V.; Lau A.; Tang B.; Cooper A.; Syed A.; Purcell J.; Chen Y.; Sharma S.; Sangrey G. R.; Darnell S. B.; Plasterer H.; Sadri-Vakili G.; Gottesfeld J. M.; Thompson L. M.; Rusche J. R.; Marsh J. L.; Thomas E. A. Histone deacetylase (HDAC) inhibitors targeting HDAC3 and HDAC1 ameliorate polyglutamine-elicited phenotypes in model systems of Huntington’s disease. Neurobiol. Dis. 2012, 46 (2), 351–61. 10.1016/j.nbd.2012.01.016. [DOI] [PMC free article] [PubMed] [Google Scholar]
- Mielcarek M.; Landles C.; Weiss A.; Bradaia A.; Seredenina T.; Inuabasi L.; Osborne G. F.; Wadel K.; Touller C.; Butler R.; Robertson J.; Franklin S. A.; Smith D. L.; Park L.; Marks P. A.; Wanker E. E.; Olson E. N.; Luthi-Carter R.; van der Putten H.; Beaumont V.; Bates G. P. HDAC4 reduction: a novel therapeutic strategy to target cytoplasmic huntingtin and ameliorate neurodegeneration. PLoS Biol. 2013, 11 (11), e1001717. 10.1371/journal.pbio.1001717. [DOI] [PMC free article] [PubMed] [Google Scholar]
- Federspiel J. D.; Greco T. M.; Lum K. K.; Cristea I. M. Hdac4 Interactions in Huntington’s Disease Viewed Through the Prism of Multiomics. Mol. Cell Proteomics 2019, 18 (8 suppl 1), S92–S113. 10.1074/mcp.RA118.001253. [DOI] [PMC free article] [PubMed] [Google Scholar]
- Benn C. L.; Butler R.; Mariner L.; Nixon J.; Moffitt H.; Mielcarek M.; Woodman B.; Bates G. P. Genetic knock-down of HDAC7 does not ameliorate disease pathogenesis in the R6/2 mouse model of Huntington’s disease. PLoS One 2009, 4 (6), e5747. 10.1371/journal.pone.0005747. [DOI] [PMC free article] [PubMed] [Google Scholar]
- Bobrowska A.; Paganetti P.; Matthias P.; Bates G. P. Hdac6 knock-out increases tubulin acetylation but does not modify disease progression in the R6/2 mouse model of Huntington’s disease. PLoS One 2011, 6 (6), e20696. 10.1371/journal.pone.0020696. [DOI] [PMC free article] [PubMed] [Google Scholar]
- Moumne L.; Campbell K.; Howland D.; Ouyang Y.; Bates G. P. Genetic knock-down of HDAC3 does not modify disease-related phenotypes in a mouse model of Huntington’s disease. PLoS One 2012, 7 (2), e31080. 10.1371/journal.pone.0031080. [DOI] [PMC free article] [PubMed] [Google Scholar]
- Mottamal M.; Zheng S.; Huang T. L.; Wang G. Histone deacetylase inhibitors in clinical studies as templates for new anticancer agents. Molecules 2015, 20 (3), 3898–941. 10.3390/molecules20033898. [DOI] [PMC free article] [PubMed] [Google Scholar]
- Burli R. W.; Luckhurst C. A.; Aziz O.; Matthews K. L.; Yates D.; Lyons K. A.; Beconi M.; McAllister G.; Breccia P.; Stott A. J.; Penrose S. D.; Wall M.; Lamers M.; Leonard P.; Muller I.; Richardson C. M.; Jarvis R.; Stones L.; Hughes S.; Wishart G.; Haughan A. F.; O’Connell C.; Mead T.; McNeil H.; Vann J.; Mangette J.; Maillard M.; Beaumont V.; Munoz-Sanjuan I.; Dominguez C. Design, synthesis, and biological evaluation of potent and selective class IIa histone deacetylase (HDAC) inhibitors as a potential therapy for Huntington’s disease. J. Med. Chem. 2013, 56 (24), 9934–54. 10.1021/jm4011884. [DOI] [PubMed] [Google Scholar]
- Luckhurst C. A.; Aziz O.; Beaumont V.; Burli R. W.; Breccia P.; Maillard M. C.; Haughan A. F.; Lamers M.; Leonard P.; Matthews K. L.; Raphy G.; Stott A. J.; Munoz-Sanjuan I.; Thomas B.; Wall M.; Wishart G.; Yates D.; Dominguez C. Development and characterization of a CNS-penetrant benzhydryl hydroxamic acid class IIa histone deacetylase inhibitor. Bioorg. Med. Chem. Lett. 2019, 29 (1), 83–88. 10.1016/j.bmcl.2018.11.009. [DOI] [PubMed] [Google Scholar]
- Luckhurst C. A.; Breccia P.; Stott A. J.; Aziz O.; Birch H. L.; Burli R. W.; Hughes S. J.; Jarvis R. E.; Lamers M.; Leonard P. M.; Matthews K. L.; McAllister G.; Pollack S.; Saville-Stones E.; Wishart G.; Yates D.; Dominguez C. Potent, Selective, and CNS-Penetrant Tetrasubstituted Cyclopropane Class IIa Histone Deacetylase (HDAC) Inhibitors. ACS Med. Chem. Lett. 2016, 7 (1), 34–9. 10.1021/acsmedchemlett.5b00302. [DOI] [PMC free article] [PubMed] [Google Scholar]
- Hermant P.; Bosc D.; Piveteau C.; Gealageas R.; Lam B.; Ronco C.; Roignant M.; Tolojanahary H.; Jean L.; Renard P. Y.; Lemdani M.; Bourotte M.; Herledan A.; Bedart C.; Biela A.; Leroux F.; Deprez B.; Deprez-Poulain R. Controlling Plasma Stability of Hydroxamic Acids: A MedChem Toolbox. J. Med. Chem. 2017, 60 (21), 9067–9089. 10.1021/acs.jmedchem.7b01444. [DOI] [PubMed] [Google Scholar]
- Lobera M.; Madauss K. P.; Pohlhaus D. T.; Wright Q. G.; Trocha M.; Schmidt D. R.; Baloglu E.; Trump R. P.; Head M. S.; Hofmann G. A.; Murray-Thompson M.; Schwartz B.; Chakravorty S.; Wu Z.; Mander P. K.; Kruidenier L.; Reid R. A.; Burkhart W.; Turunen B. J.; Rong J. X.; Wagner C.; Moyer M. B.; Wells C.; Hong X.; Moore J. T.; Williams J. D.; Soler D.; Ghosh S.; Nolan M. A. Selective class IIa histone deacetylase inhibition via a nonchelating zinc-binding group. Nat. Chem. Biol. 2013, 9 (5), 319–25. 10.1038/nchembio.1223. [DOI] [PubMed] [Google Scholar]
- Guerriero J. L.; Sotayo A.; Ponichtera H. E.; Castrillon J. A.; Pourzia A. L.; Schad S.; Johnson S. F.; Carrasco R. D.; Lazo S.; Bronson R. T.; Davis S. P.; Lobera M.; Nolan M. A.; Letai A. Class IIa HDAC inhibition reduces breast tumours and metastases through anti-tumour macrophages. Nature 2017, 543 (7645), 428–432. 10.1038/nature21409. [DOI] [PMC free article] [PubMed] [Google Scholar]
- Freeman B. B. 3rd; Yang L.; Rankovic Z. Practical approaches to evaluating and optimizing brain exposure in early drug discovery. Eur. J. Med. Chem. 2019, 182, 111643. 10.1016/j.ejmech.2019.111643. [DOI] [PubMed] [Google Scholar]
- Hebach C.; Joly E.; Kallen J.; Ternois J. G.; Tintelnot-Blomley M.. Novel trifluoromethyl-oxadiazole derivatives and their use in the treatment of disease. WO2013080120, 2013.
- Beconi M.; Aziz O.; Matthews K.; Moumne L.; O’Connell C.; Yates D.; Clifton S.; Pett H.; Vann J.; Crowley L.; Haughan A. F.; Smith D. L.; Woodman B.; Bates G. P.; Brookfield F.; Burli R. W.; McAllister G.; Dominguez C.; Munoz-Sanjuan I.; Beaumont V. Oral administration of the pimelic diphenylamide HDAC inhibitor HDACi 4b is unsuitable for chronic inhibition of HDAC activity in the CNS in vivo. PLoS One 2012, 7 (9), e44498. 10.1371/journal.pone.0044498. [DOI] [PMC free article] [PubMed] [Google Scholar]
- Buscemi S.; Pace A.; Palumbo Piccionello A.; Macaluso G.; Vivona N.; Spinelli D.; Giorgi G. Fluorinated heterocyclic compounds. An effective strategy for the synthesis of fluorinated Z-oximes of 3-perfluoroalkyl-6-phenyl-2h-1,2,4-triazin-5-ones via a ring-enlargement reaction of 3-benzoyl-5-perfluoroalkyl-1,2,4-oxadiazoles and hydrazine. J. Org. Chem. 2005, 70 (8), 3288–91. 10.1021/jo047766s. [DOI] [PubMed] [Google Scholar]
Associated Data
This section collects any data citations, data availability statements, or supplementary materials included in this article.


