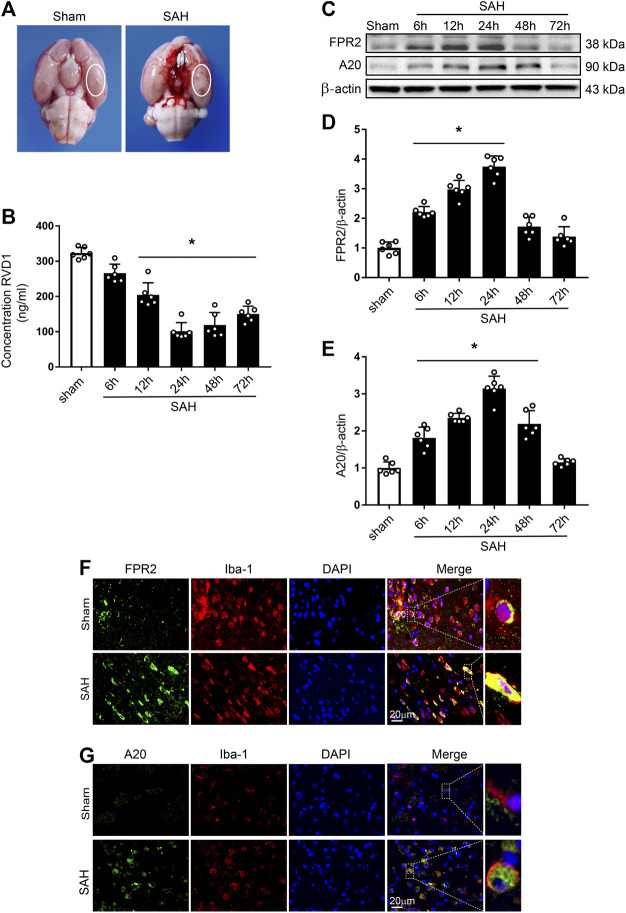
FIGURE 1.
Time course of expression of endogenous RVD1, FPR2, and A20 after subarachnoid hemorrhage (SAH). (A) Brain images of sham and SAH rats. Schematic illustration of the optimal brain region for staining with a white oval frame. (B) ELISA indicating RVD1 expression after SAH. (C) Representative western blot bands of FPR2 and A20 (D, E). The intensity of each protein band was quantified and normalized with β-actin. (F) Representative images of double immunofluorescence staining show that FPR2 and A20 (green) are highly expressed in microglia (Iba-1, red). Scale bar = 20 μm; *p < 0.05 vs. sham group, n = 6 per group.

