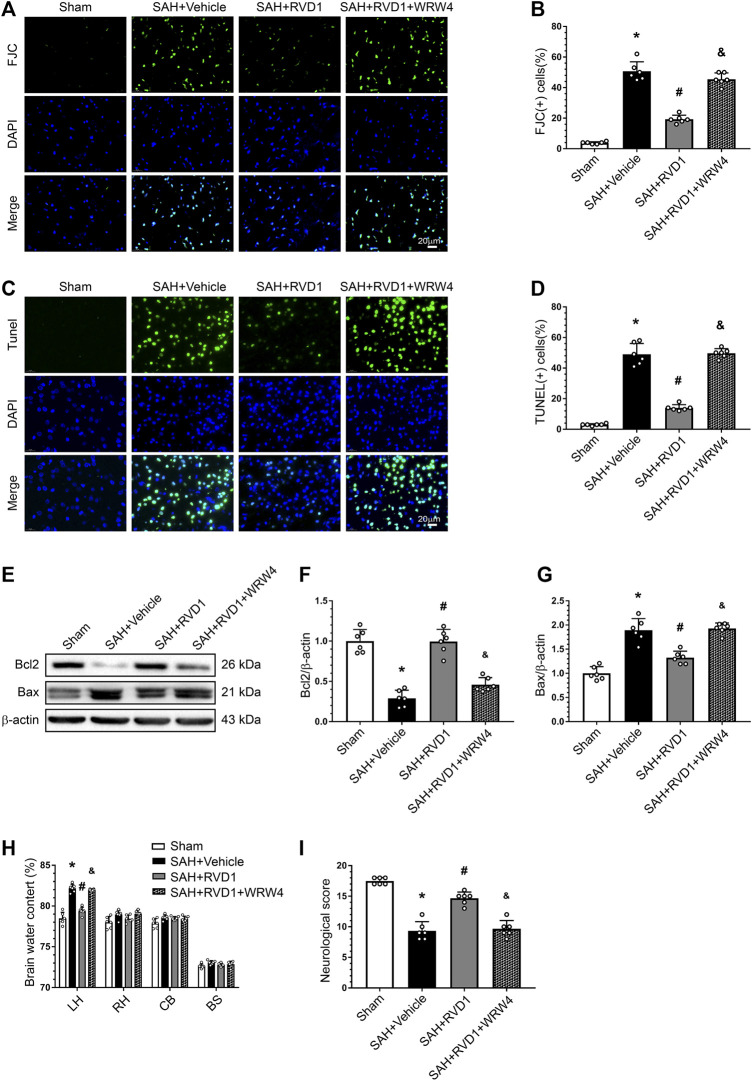
FIGURE 6.
Effects of RVD1 and WRW4 on neuronal cells after SAH. (A, C) Representative microfluorescence images and (B, D) quantitative analysis of FJC- and TUNEL-positive cells. (E) Representative western blot bands and (F, G) quantitative analysis of Bcl2 and Bax expression. (H) Brain water content. (I) Neurological score in different groups. Scale bar = 20 μm; *p < 0.05 vs. sham group, # p < 0.05 vs. SAH + vehicle group, & p < 0.05 vs. RVD1 group; n = 6 per group.

