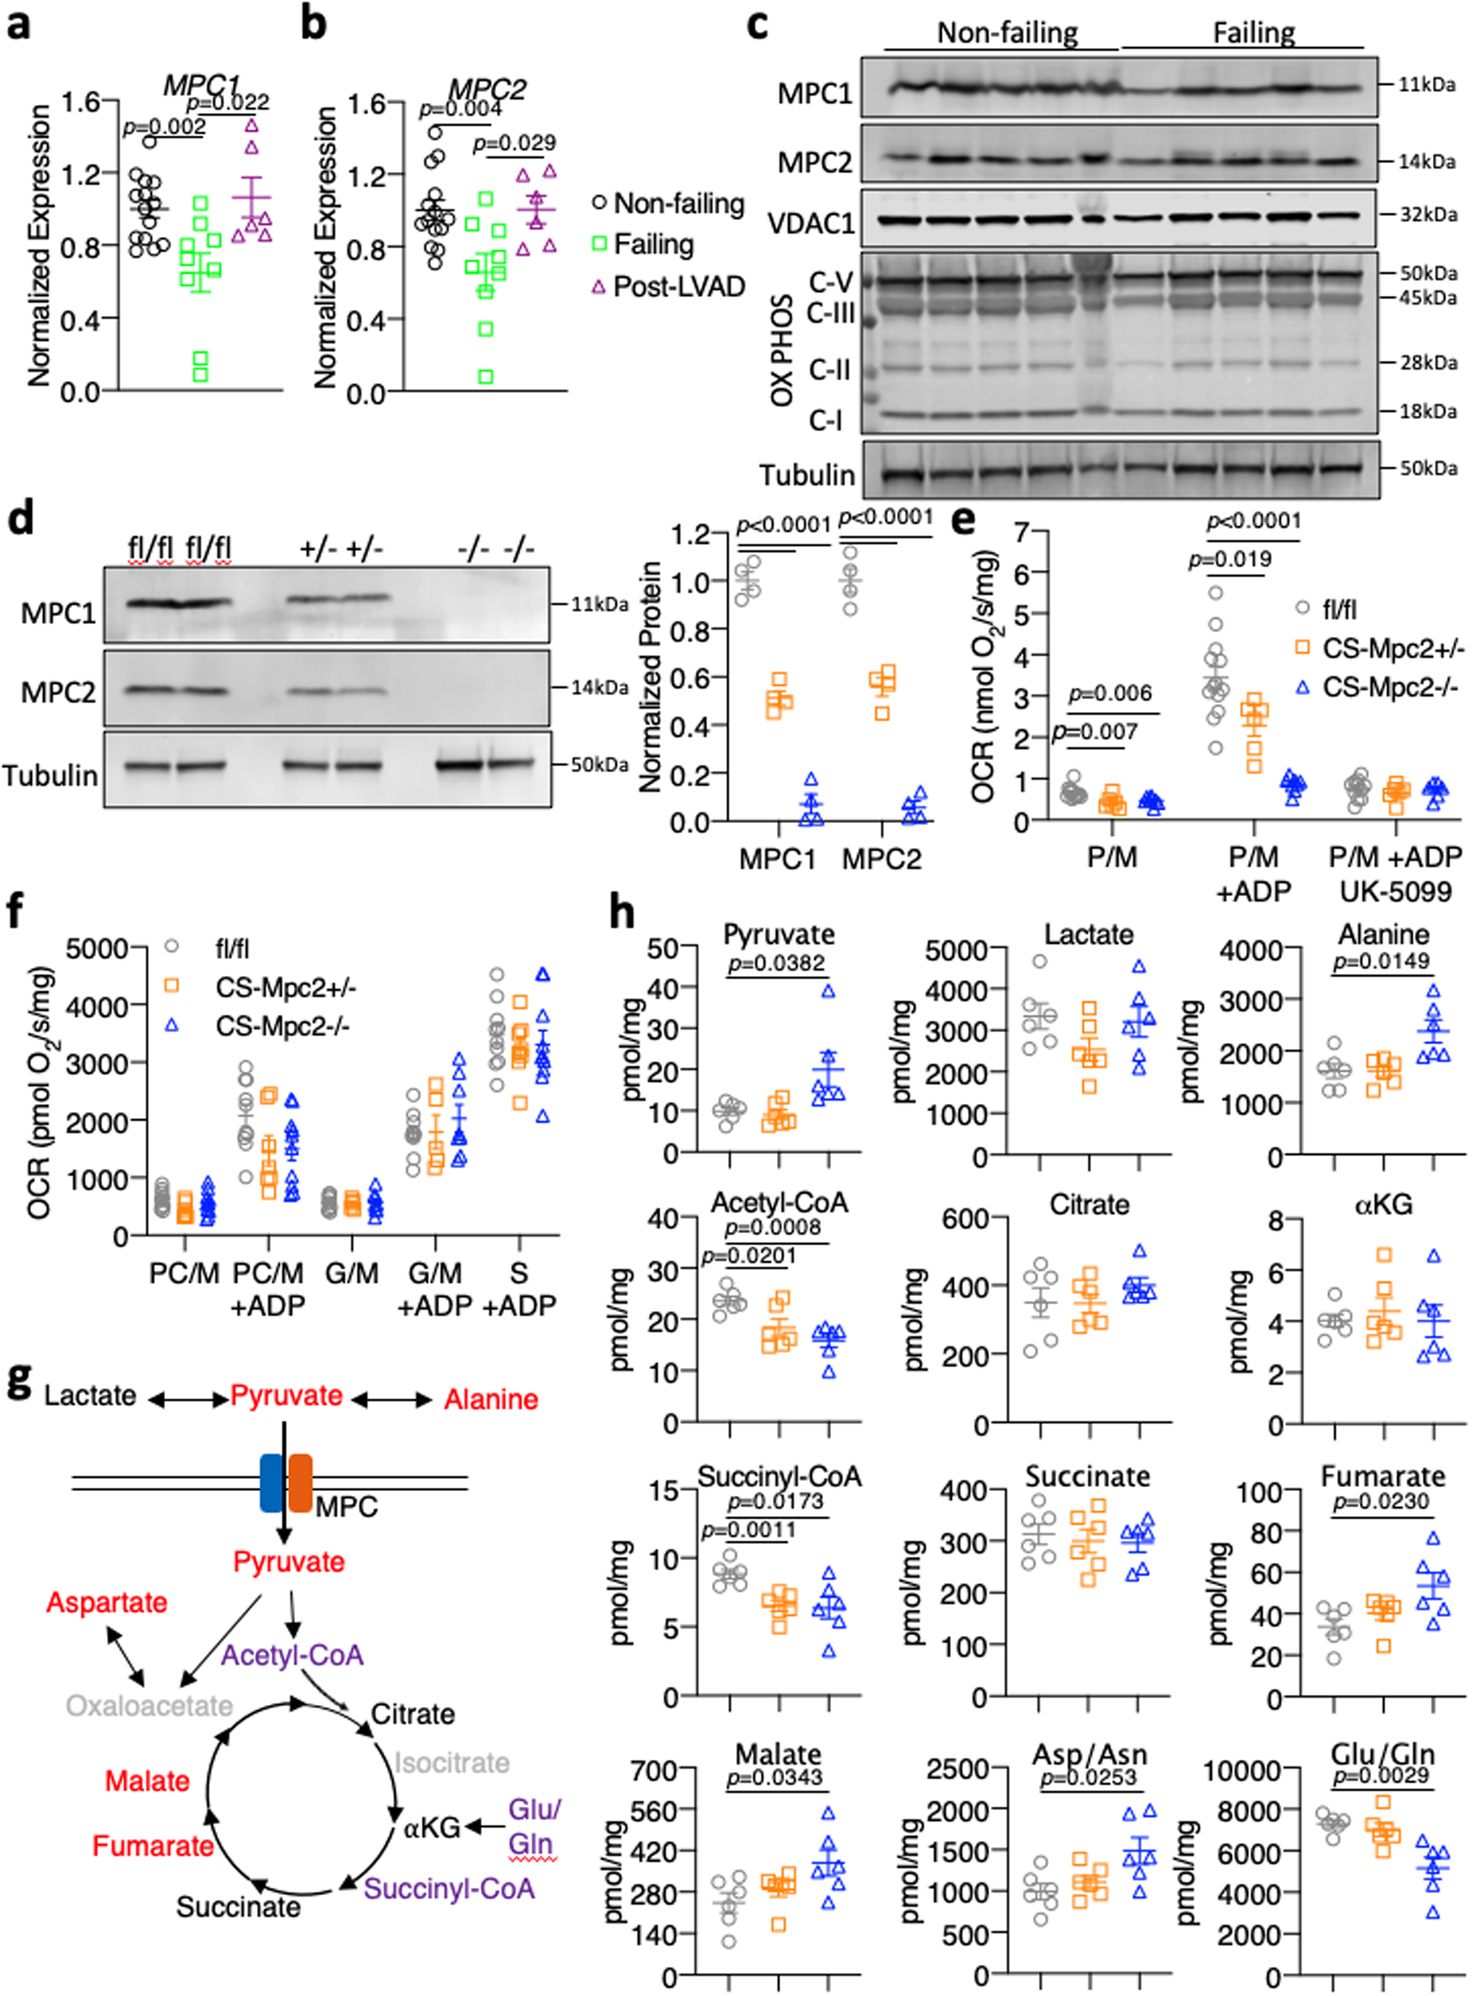
Fig. 1: MPCs downregulated in human heart failure, deletion of cardiac MPC2 results in TCA cycle dysfunction.

a-b, Gene expression measured by qRT-PCR for MPC1 and MPC2 normalized to RPLP0 from human hearts of non-failing, failing, and failing hearts Post-left ventricular assist device (LVAD) implant (n=14, 9, and 6 for Non-failing, Failing, and Post-LVAD, respectively). c, Western blot images for MPC1, MPC2, VDAC1, OX PHOS subunits, and αTubulin in non-failing and failing human heart tissue (n=5). d, Representative western blots of MPC1, MPC2, and αTubulin of mouse heart tissue and densitometry quantification (n=4). e, Oxygen consumption rates (OCR) stimulated by pyruvate/malate (P/M) of isolated cardiac mitochondria before and after addition of ADP and 5μM of the MPC-inhibitor UK-5099 (n=13, 6, and 8 for fl/fl, CS-Mpc2+/−, and CS-Mpc2−/−, respectively). f, Oxygen consumption rates stimulated by palmitoyl carnitine/malate (PC/M), glutamate/malate (G/M) or succinate (S) before or after the addition of ADP measured from isolated cardiac mitochondria (n=10, 8, and 10 for fl/fl, CS-Mpc2+/−, and CS-Mpc2−/−, respectively). g, Schematic of TCA cycle alterations measured by metabolomic analyses of heart tissue. red=increased, purple=decreased, black=unchanged (comparing fl/fl to CS-Mpc2−/−), and grey=unmeasured. h, TCA cycle intermediates (Pyruvate, Lactate, Alanine, Acetyl-CoA, Citrate, α-ketoglutarate, Succinyl-CoA, Succinate, Fumarate, Malate, Aspartate/Asparagine, and Glutamate/Glutamine) measured by mass-spectrometry from 6-week old heart tissue (n=6). Mean ± s.e.m. shown within dot plot. Each symbol represents an individual sample. Two-tailed unpaired Student’s t test.
