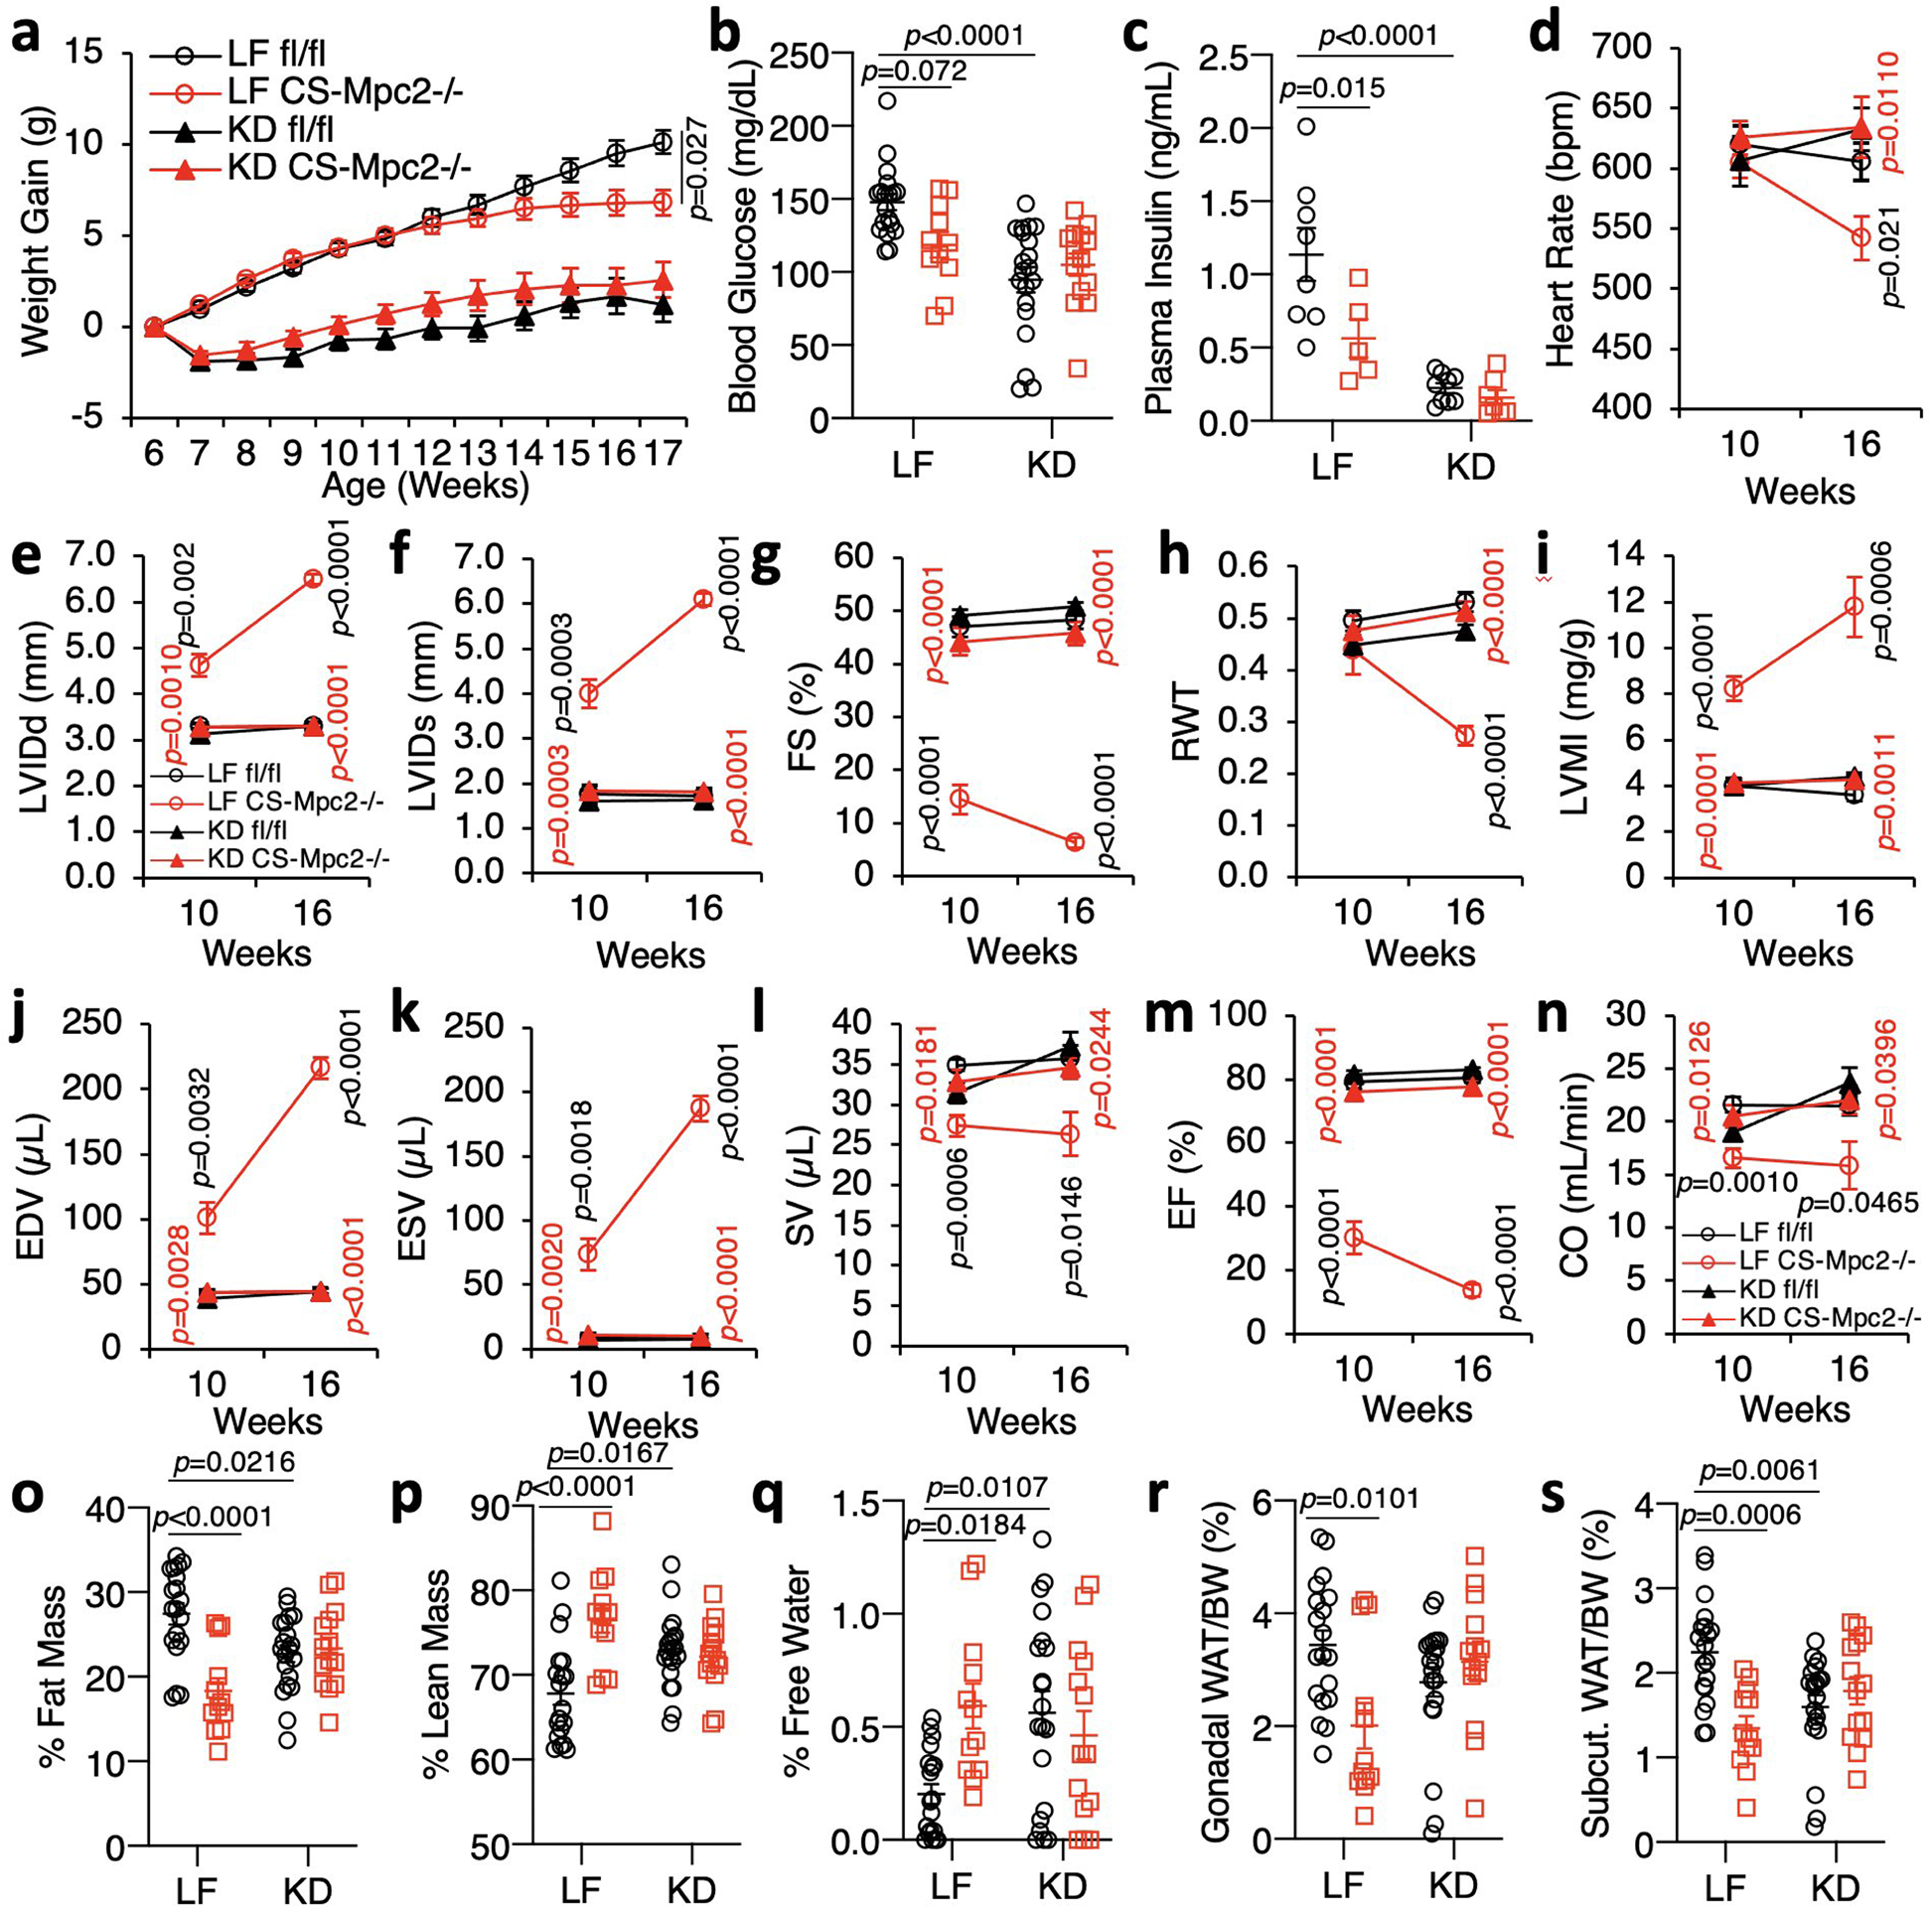
Extended Data Fig. 3: Ketogenic diet prevents heart failure in CS-MPC2−/− mice.

a, Body weights of mice fed low fat (LF) or ketogenic diet (KD) from 6–17 weeks of age (initial n=19, 15, 21, and 14 for fl/fl LF, CS-Mpc2−/− LF, fl/fl KD, and CS-Mpc2−/− KD, respectively)(fl/fl LF vs KD p<0.0001; CS-Mpc2−/− LF vs KD p<0.0001). b-c, Blood glucose and plasma insulin measured after a 4 h fast (n=19, 11, 20, and 14, respectively for glucose and 8, 5, 9, and 7, respectively for insulin). d-n, Echocardiography data at 10 and 16 weeks of age. Left ventricular internal diameter at end diastole (LVIDd) and end systole (LVIDs), fractional shortening (FS), relative wall thickness (RWT), end diastolic volume (EDV), end systolic volume (ESV), stroke volume (SV), ejection fraction (EF), and cardiac output (CO) (n=9, 7, 12, and 9 for fl/fl LF, CS-Mpc2−/− LF, fl/fl KD, and CS-Mpc2−/− KD, respectively). o-q, % Fat mass, % lean mass, and % free water body composition measured by echoMRI (n= 19, 12, 20, and 14, respectively). r-s, Gonadal and inguinal white adipose tissue (WAT) weights normalized to body weight (n=19, 12, 20, and 14, respectively). Data are presented as mean ± s.e.m. or mean ± s.e.m. within dot plot. Each data point in dot plot represents one individual mouse sample. Two-way ANOVA with Tukey’s multiple comparisons test. For d-n, black p values indicate LF-fed fl/fl vs. CS-Mpc2−/−, red p values indicate LF vs. KD for CS-Mpc2−/− for each echocardiography date.
