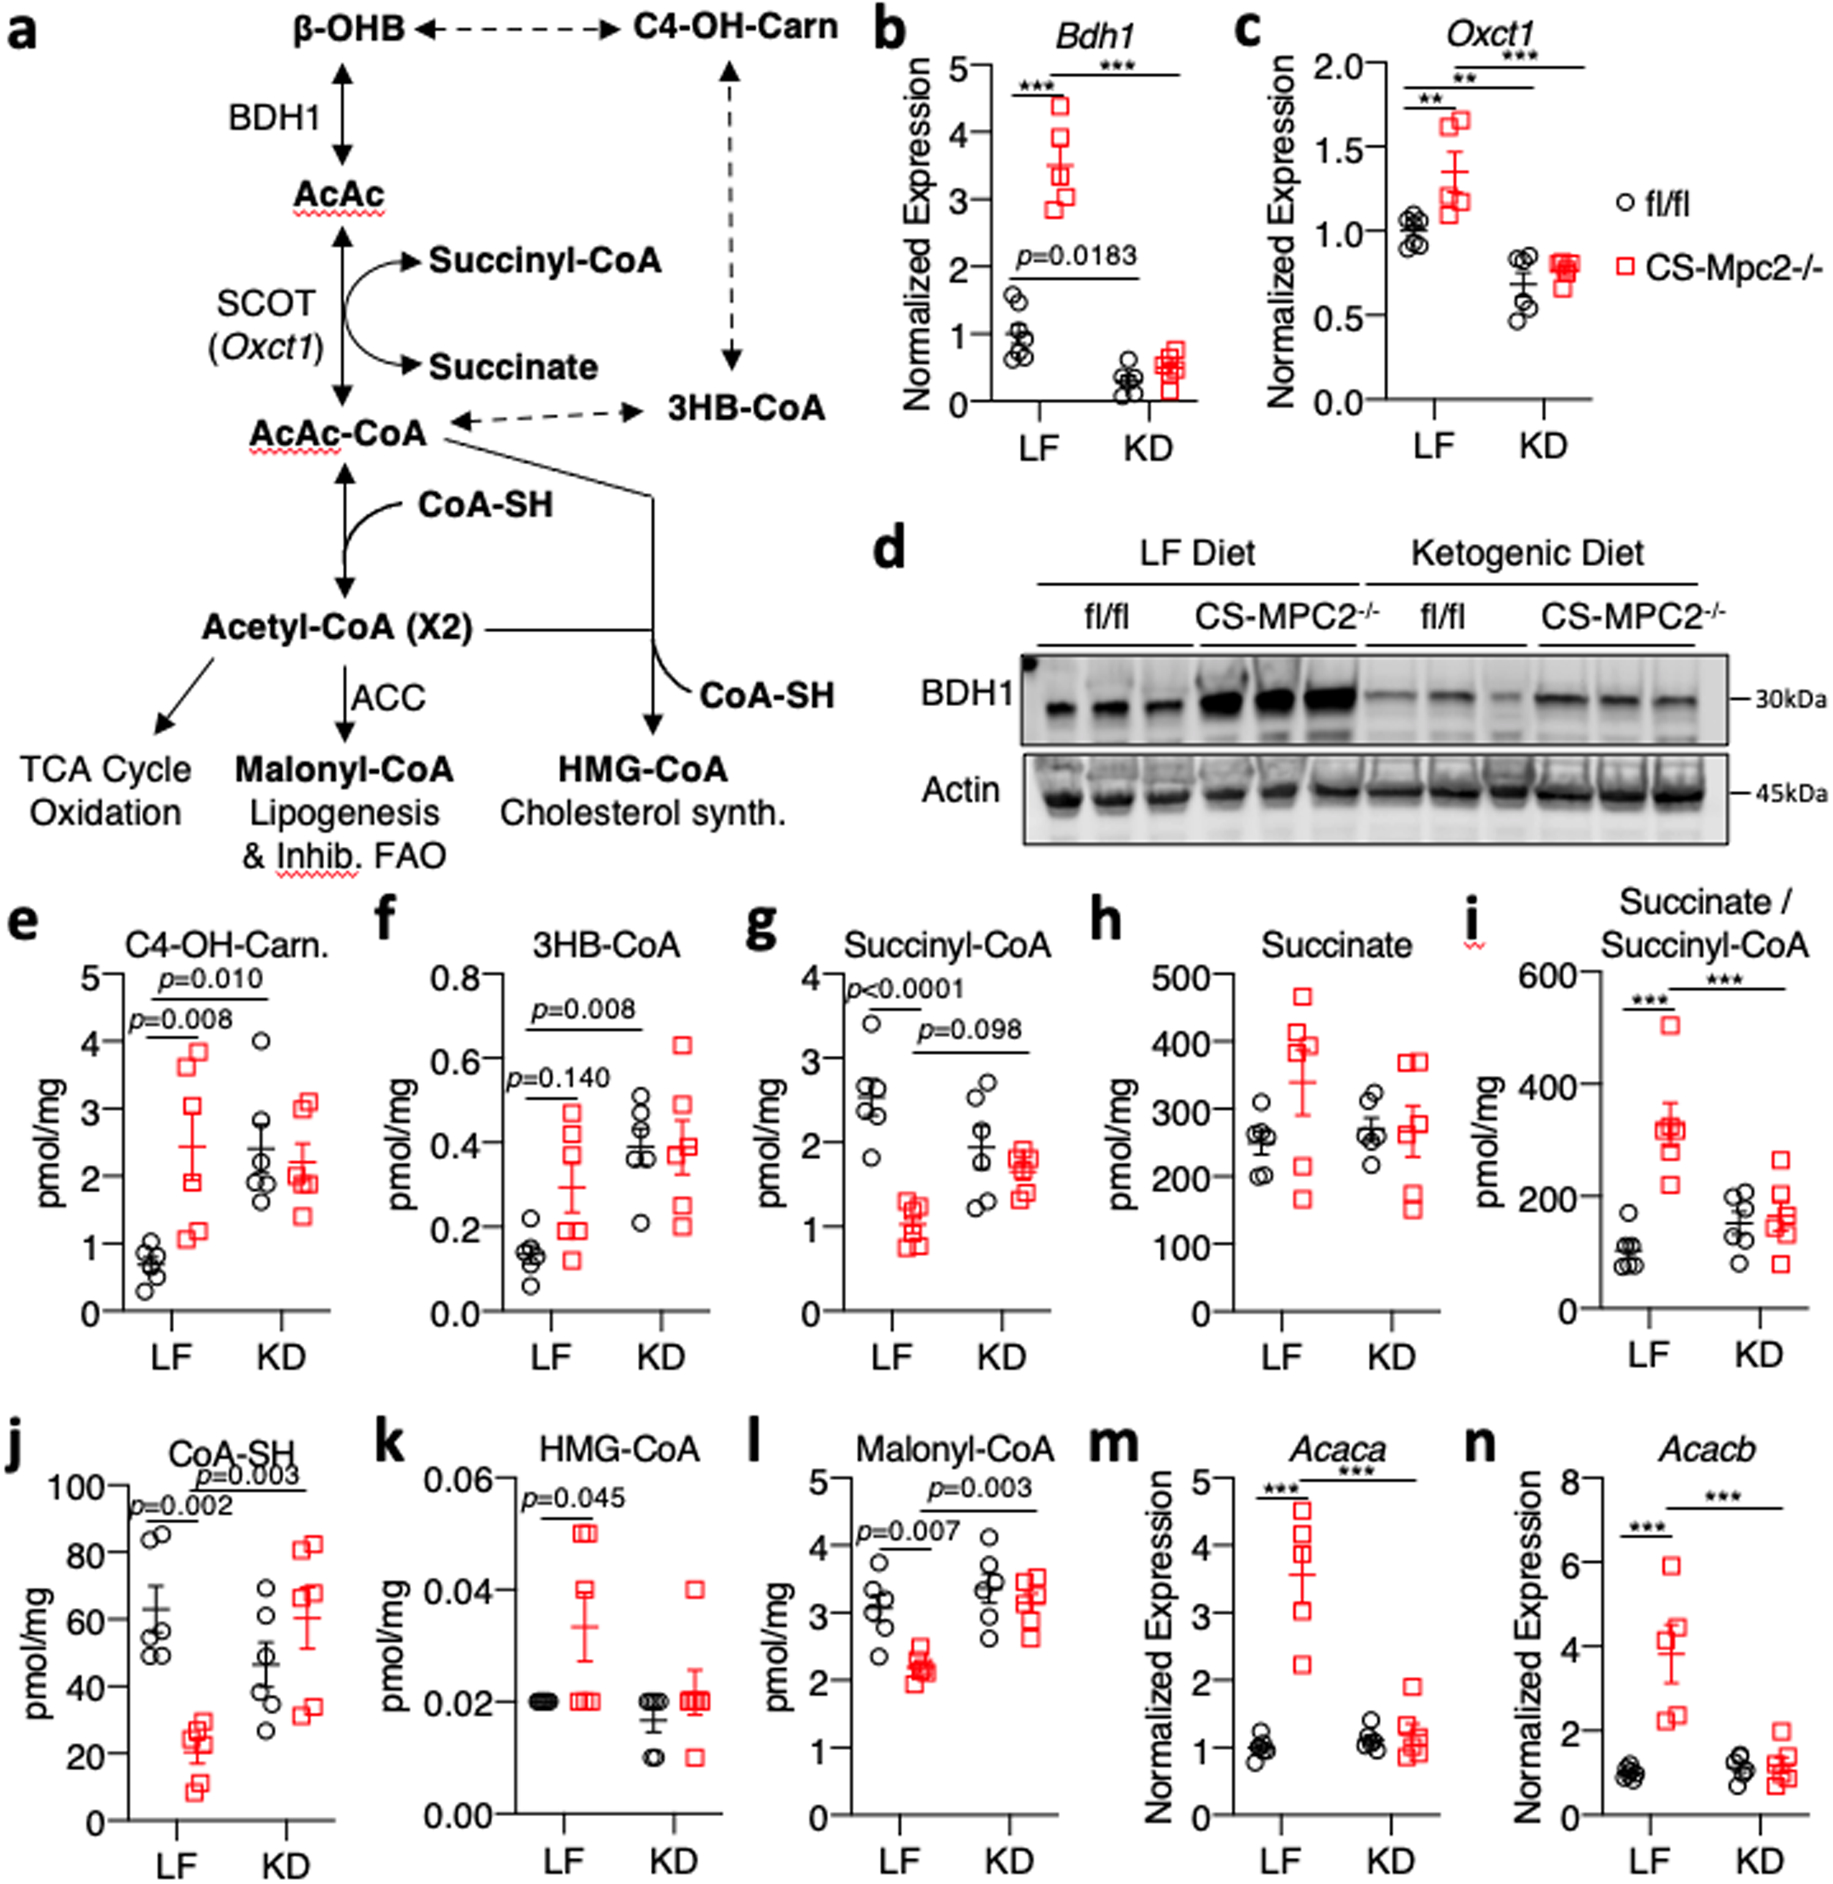
Fig. 4: Ketogenic diet downregulates cardiac ketone body catabolism.

a, Schematic of oxidative and non-oxidative ketone body catabolism. b-c, Gene expression for the ketolytic enzymes Bdh1 and Oxct1 from hearts of low fat (LF)- or ketogenic diet (KD)-fed fl/fl or CS-Mpc2−/− mice (n=7, 5, 6, and 6 for fl/fl LF, CS-Mpc2−/− LF, fl/fl KD, and CS-Mpc2−/− KD, respectively)(Oxct1: p=0.0058 for LF fl/fl vs CS-Mpc2−/−, p=0.0083 for fl/fl LF vs KD). d, Western blot images of BDH1 and Actin from heart tissue of LF- or KD-fed mice (n=3). e-l, Cardiac concentrations of metabolites associated with ketone body catabolism measured in hearts from LF- or KD-fed mice (n=6). m-n, Gene expression for Acaca and Acacb normalized to Rplp0 from hearts of LF- and KD-fed mice (n=7, 5, 6, and 6 for fl/fl LF, CS-Mpc2−/− LF, fl/fl KD, and CS-Mpc2−/− KD, respectively). Mean ± s.e.m. shown within dot plot. Each symbol represents an individual sample. Two-way ANOVA with Tukey’s multiple-comparisons test. *P < 0.05, **P < 0.01, ***P < 0.001.
