
Fig. 5: Ketogenic diet enhances cardiac fatty acid metabolism.
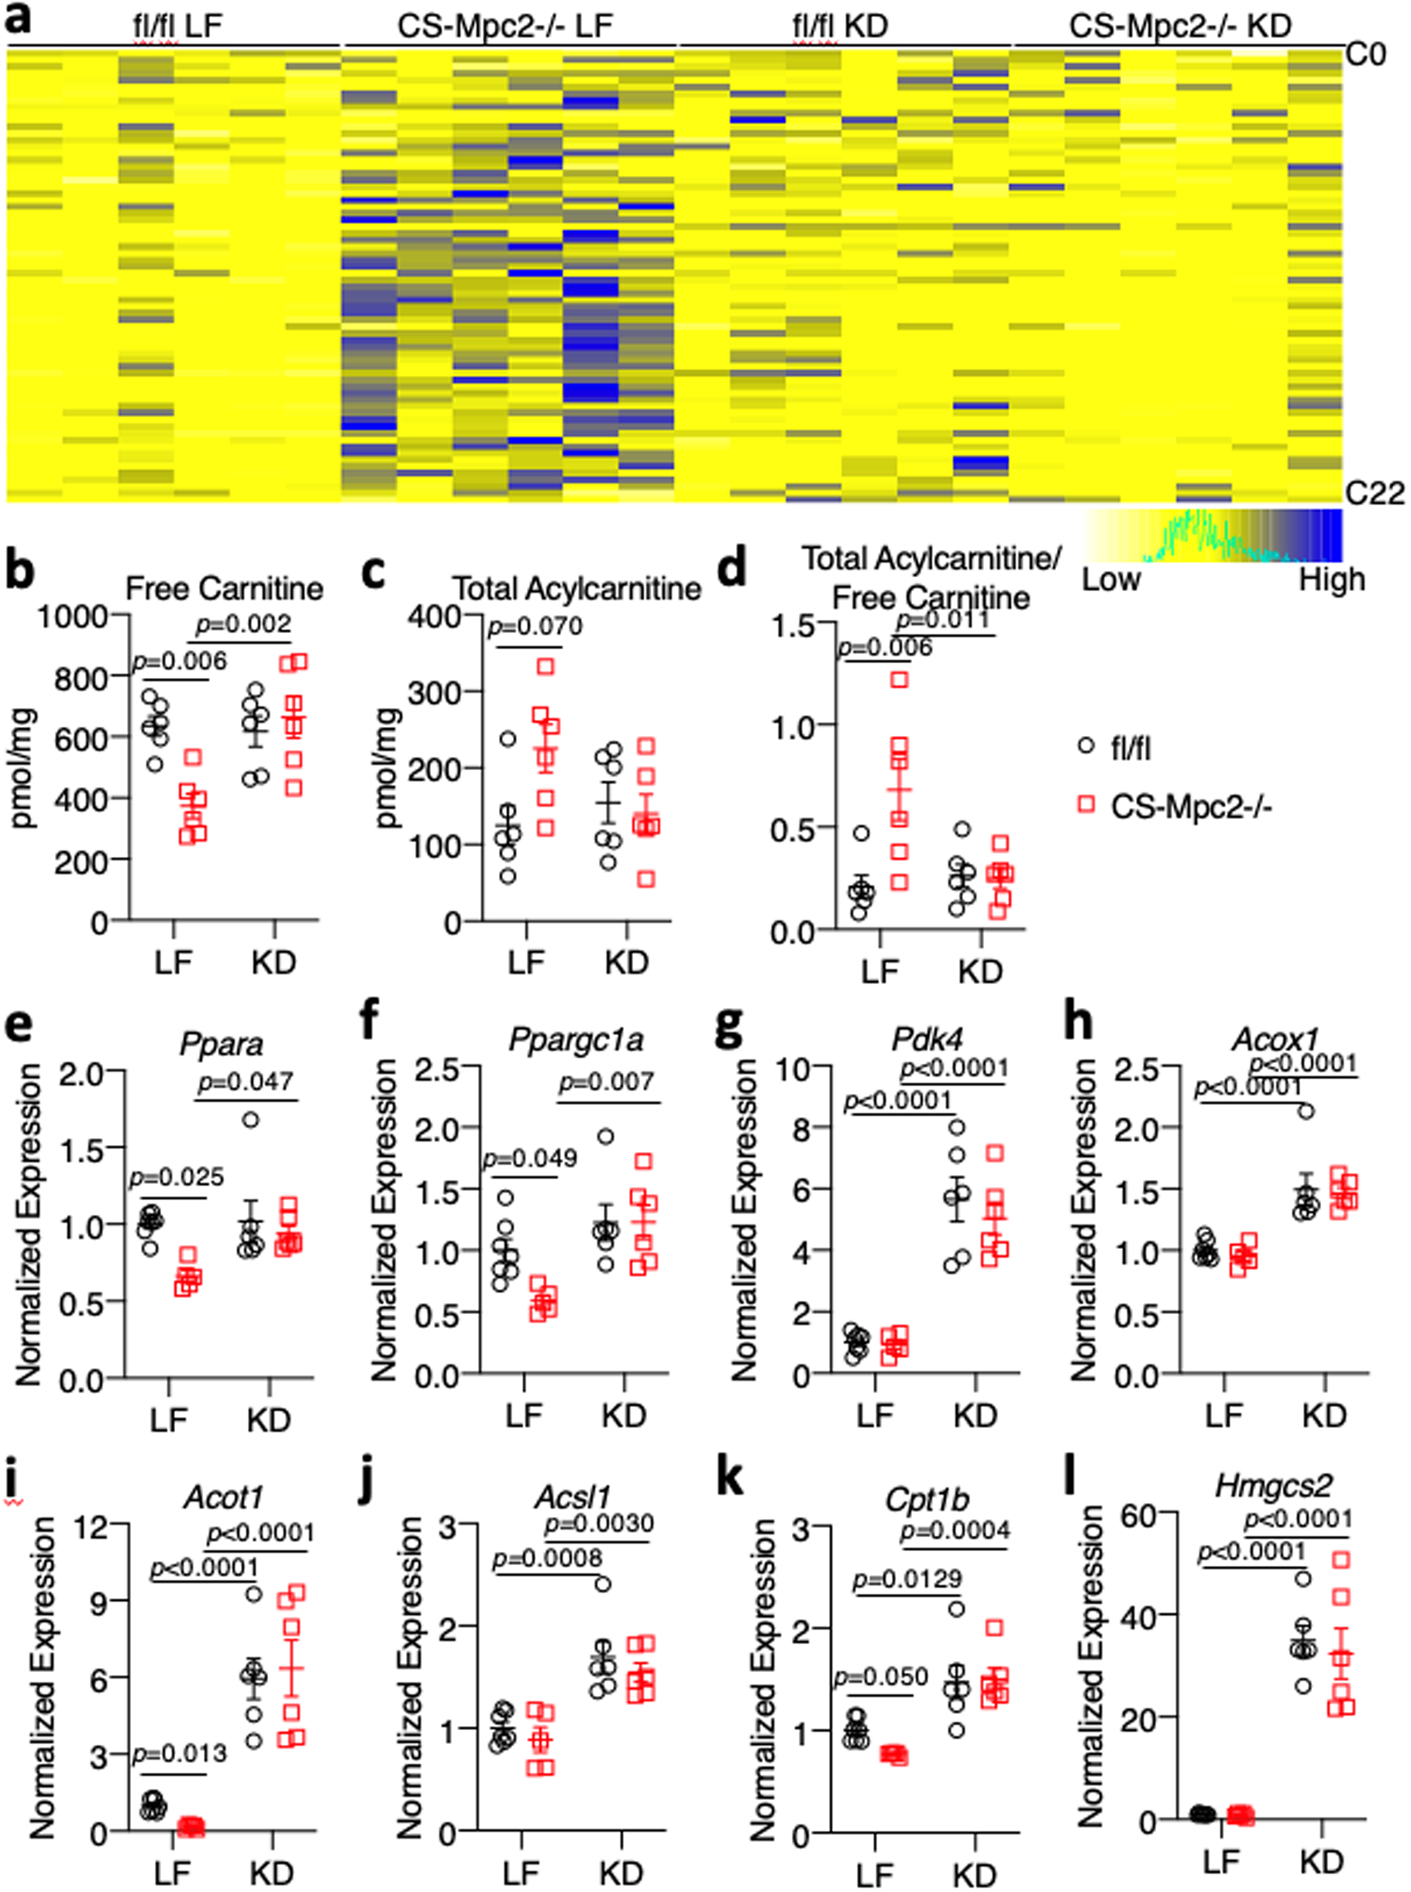
a, Heatmap of acylcarnitine species measured in hearts of low fat (LF)- or ketogenic diet (KD)-fed fl/fl or CS-Mpc2−/− mice (n=6). b-d, Concentrations of free carnitine, total acylcarnitines, and the acylcarnitine/free carnitine ratio measured by mass-spectrometry of heart tissue (n=6). e-l, Gene expression markers of PPARα and fatty acid oxidation (Ppara, Ppargc1a, Pdk4, Acox1, Acot1, Acsl1, Cpt1b, and Hmgcs2) from heart tissue of LF- or KD-fed mice (n=7, 5, 6, and 6 for fl/fl LF, CS-Mpc2−/− LF, fl/fl KD, and CS-Mpc2−/− KD, respectively). Mean ± s.e.m. shown within dot plot. Each symbol represents an individual sample. Two-way ANOVA with Tukey’s multiple-comparisons test.