
Fig. 6: High fat diets also prevent cardiac remodeling and dysfunction in CS-MPC2−/− mice.
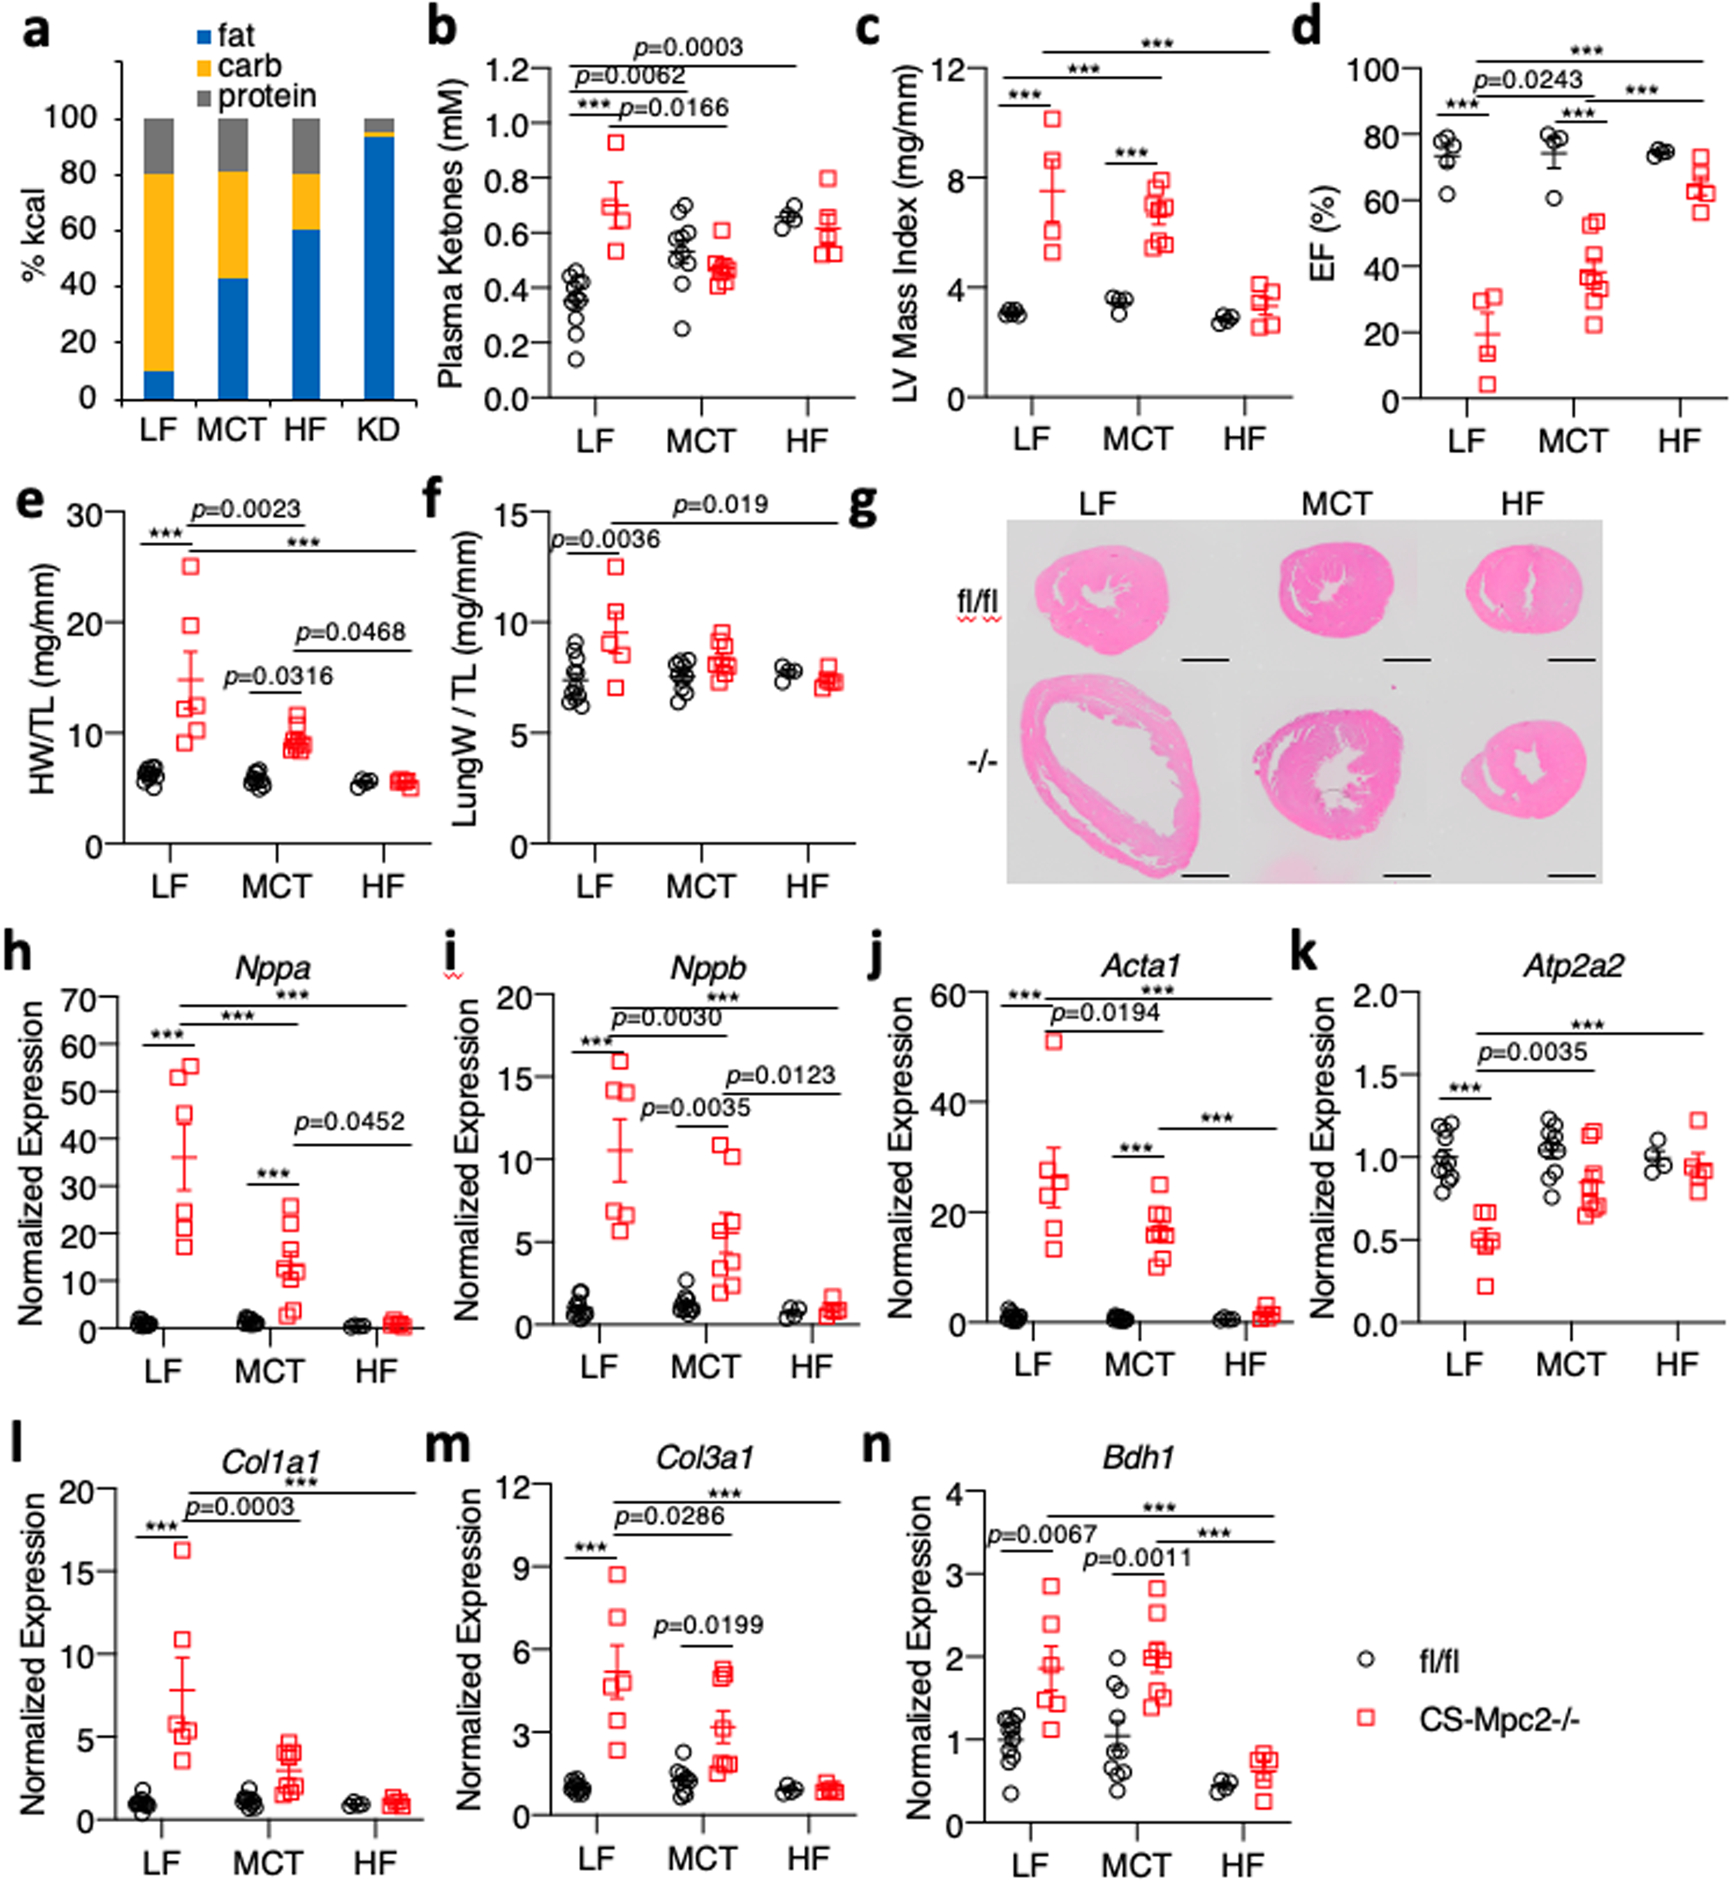
a, Comparison of diet macronutrient composition for low fat (LF), medium chain triglyceride (MCT), high fat (HF), and ketogenic diet (KD). b, Plasma total ketone body concentrations measured from mice after LF, MCT, or HF diet feeding (n=11, 4, 10, 8, 4, and 5 for fl/fl LF, CS-Mpc2−/− LF, fl/fl MCT, CS-Mpc2−/− MCT, fl/fl HF, and CS-Mpc2−/− HF, respectively). c-d, Echocardiography measures of left ventricular (LV) mass index and ejection fraction (EF) of mice fed LF, MCT, or HF diets (n=5, 4, 4, 8, 4, and 5 for fl/fl LF, CS-Mpc2−/− LF, fl/fl MCT, CS-Mpc2−/− MCT, fl/fl HF, and CS-Mpc2−/− HF, respectively). e-f, Heart weight and lung weight normalized to tibia length (n=11, 6, 10, 8, 4, and 5 for fl/fl LF, CS-Mpc2−/− LF, fl/fl MCT, CS-Mpc2−/− MCT, fl/fl HF, and CS-Mpc2−/− HF, respectively). g, Representative short-axis heart images stained with H&E (scale bar = 1mm; similar results obtained during four independent experiments of littermate mice). h-n, Gene expression markers of hypertrophy, heart failure, fibrosis, and the ketolytic enzyme Bdh1 from mouse hearts (n=11, 6, 10, 8, 4, and 5 for fl/fl LF, CS-Mpc2−/− LF, fl/fl MCT, CS-Mpc2−/− MCT, fl/fl HF, and CS-Mpc2−/− HF, respectively). Mean ± s.e.m. shown within dot plot. Each symbol represents an individual sample. Two-way ANOVA with Tukey’s multiple-comparisons test. Exact p values given unless ***P < 0.0001.