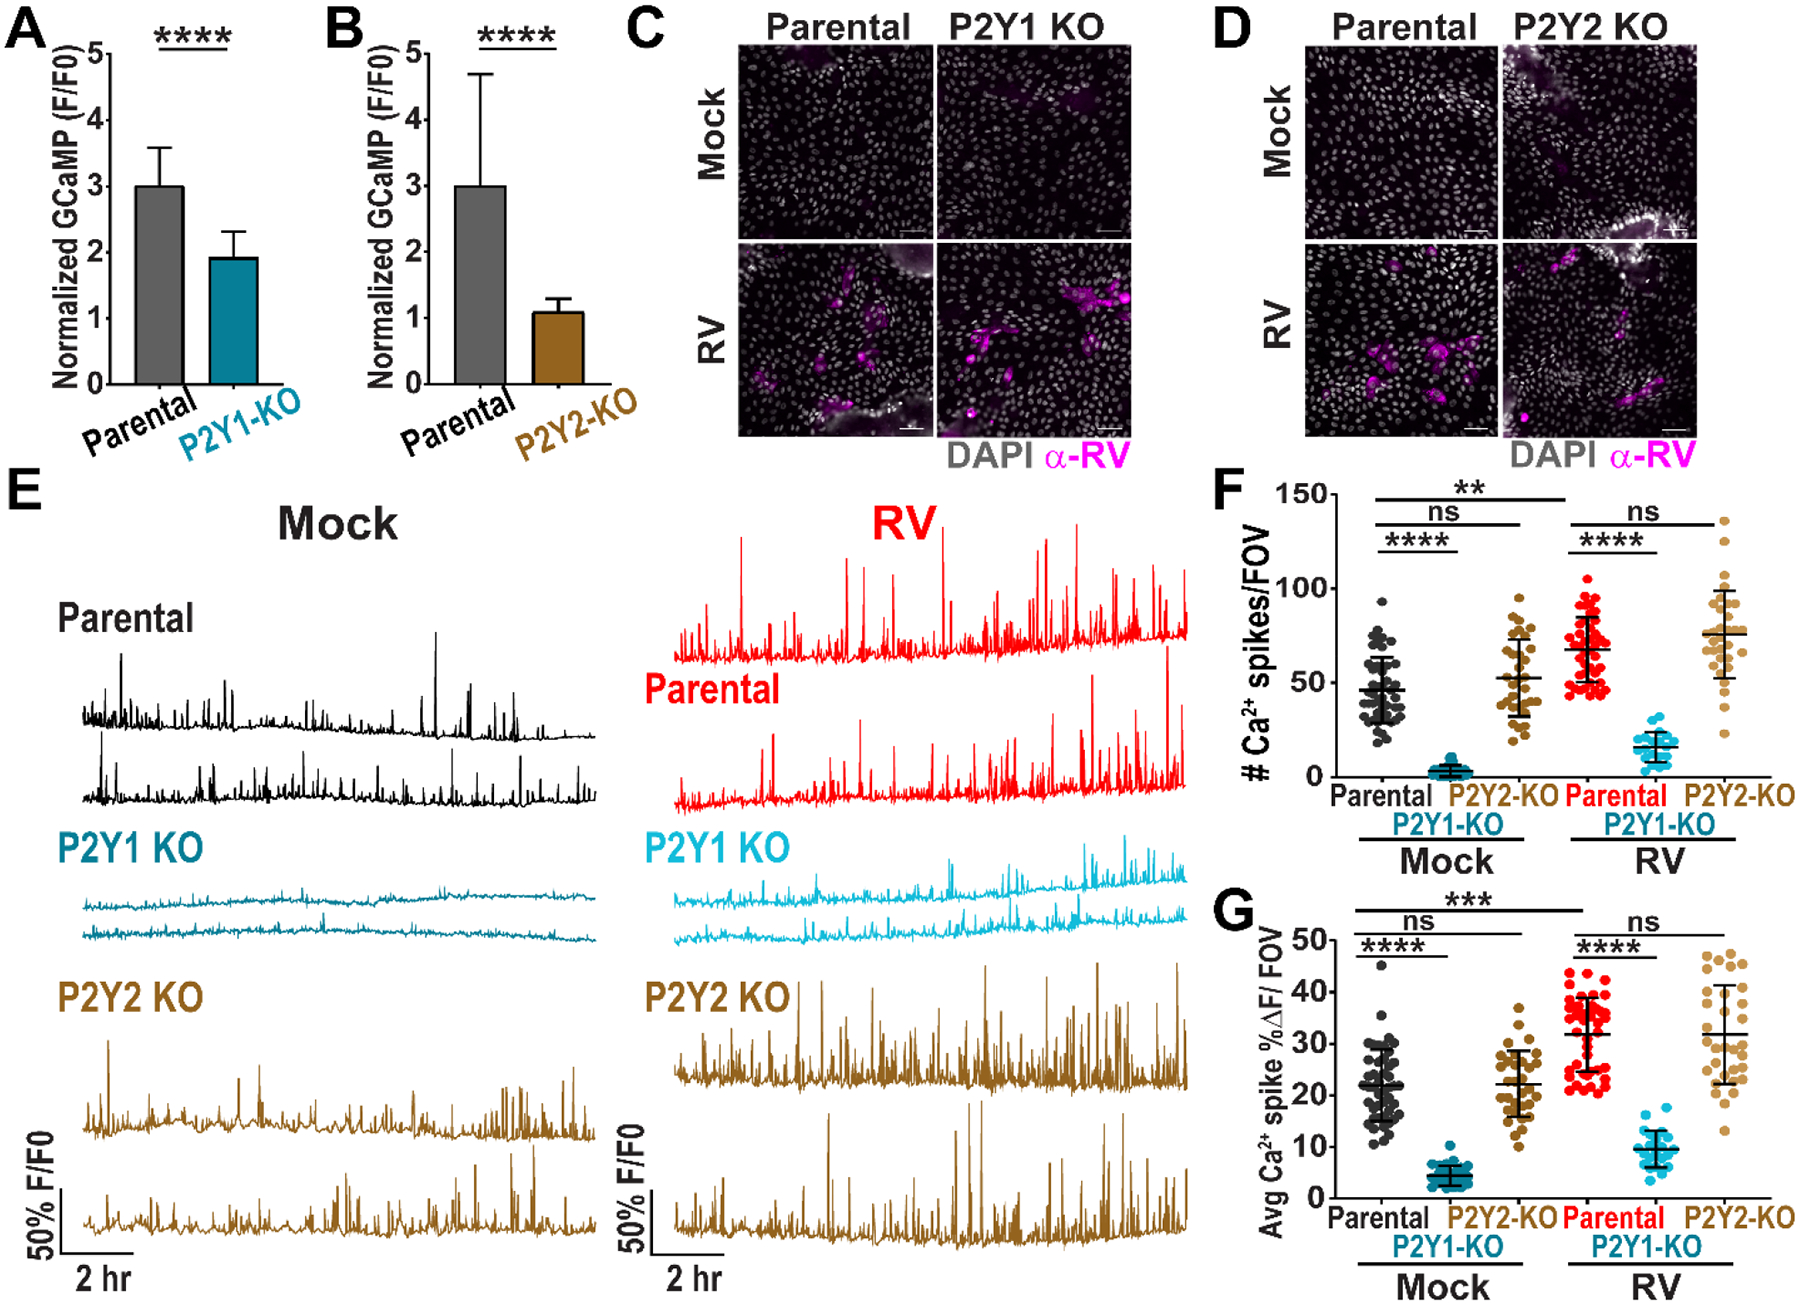
Figure 5. CRISPR/Cas9 knockout of P2Y1 receptor in jHIEs reduces intercellular calcium waves.

(A-B) Normalized GCaMP fluorescence increase in (A) parental or P2Y1 knockout (KO) (J2)HIE-GCaMP6s monolayers treated with 10 nM ADP (n=75 cells, data combined from N=3 independent experiments) and (B) parental or P2Y2 KO (J2)HIE-GCaMP6s monolayers treated with 10 μM ATP-γS (n=30 cells, data representative of N=3 independent experiments). (C-D) Parental or P2Y1 KO jHIE-GCaMP6s or parental or P2Y2 KO jHIE-GCaMP6s monolayers mock- or RV-infected, fixed at 24 hpi, and immunostained for RV antigen (pink) and counterstained with DAPI (gray). (E) Representative Ca2+ traces per field-of-view (FOV) of mock- or RV-infected parental, P2Y1 KO jHIE-GCaMP6s, or P2Y2 KO jHIE-GCaMP6s monolayers. (F) Ca2+ spikes/FOV and (G) average magnitude of Ca2+ spikes/FOV. (A-B) Mann-Whitney test or (F-G) Kruskal-Wallis with Dunn’s multiple corrections test used. Scale bar = 50 μm. Data represented as mean ± SD, (***p<0.001, ****p<0.0001).
