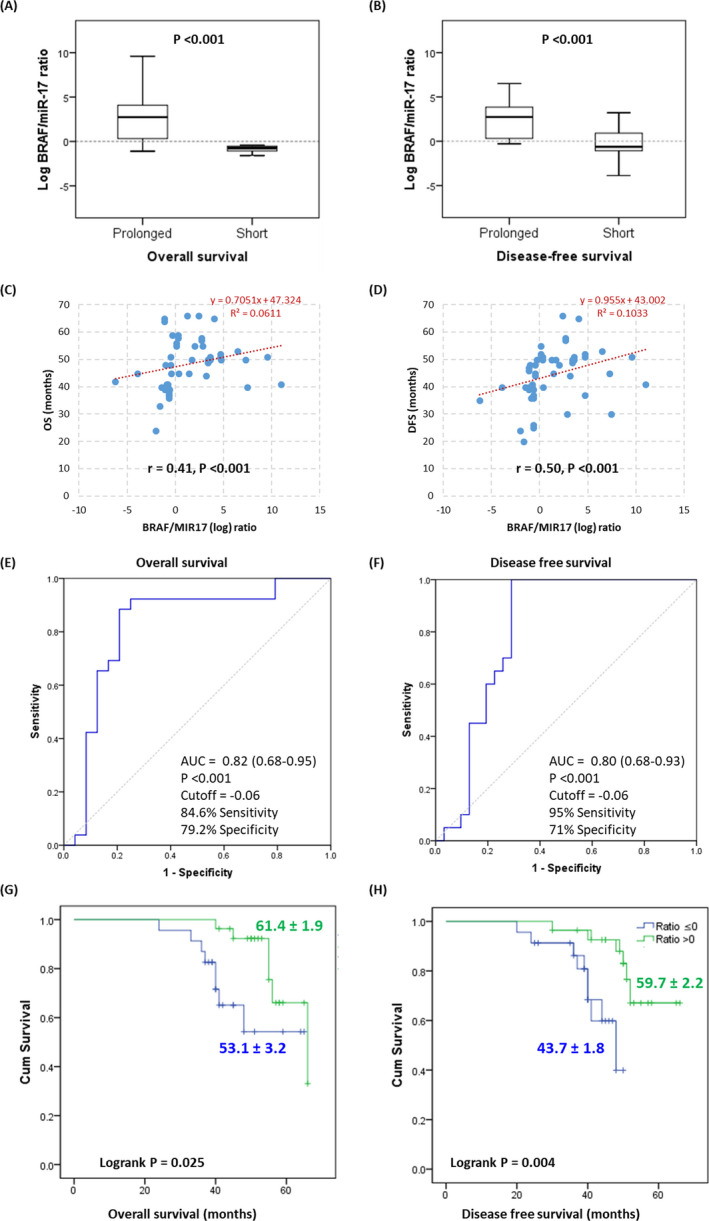
Figure 6.

Prognostic value of the BRAF/miR‐17 ratio for detecting survival. (A‐B) Association of BRAF/MIR17 expression ratio with survival. (C‐D) Spearman correlation analysis between gene expression and survival. (E‐F) Receiver characteristic operator curve to discriminate between prolonged and short survivors. (G‐H) Kaplan‐Meier survival curve for overall and disease‐free survival. LogRank (Mantel‐Cox) test was used
