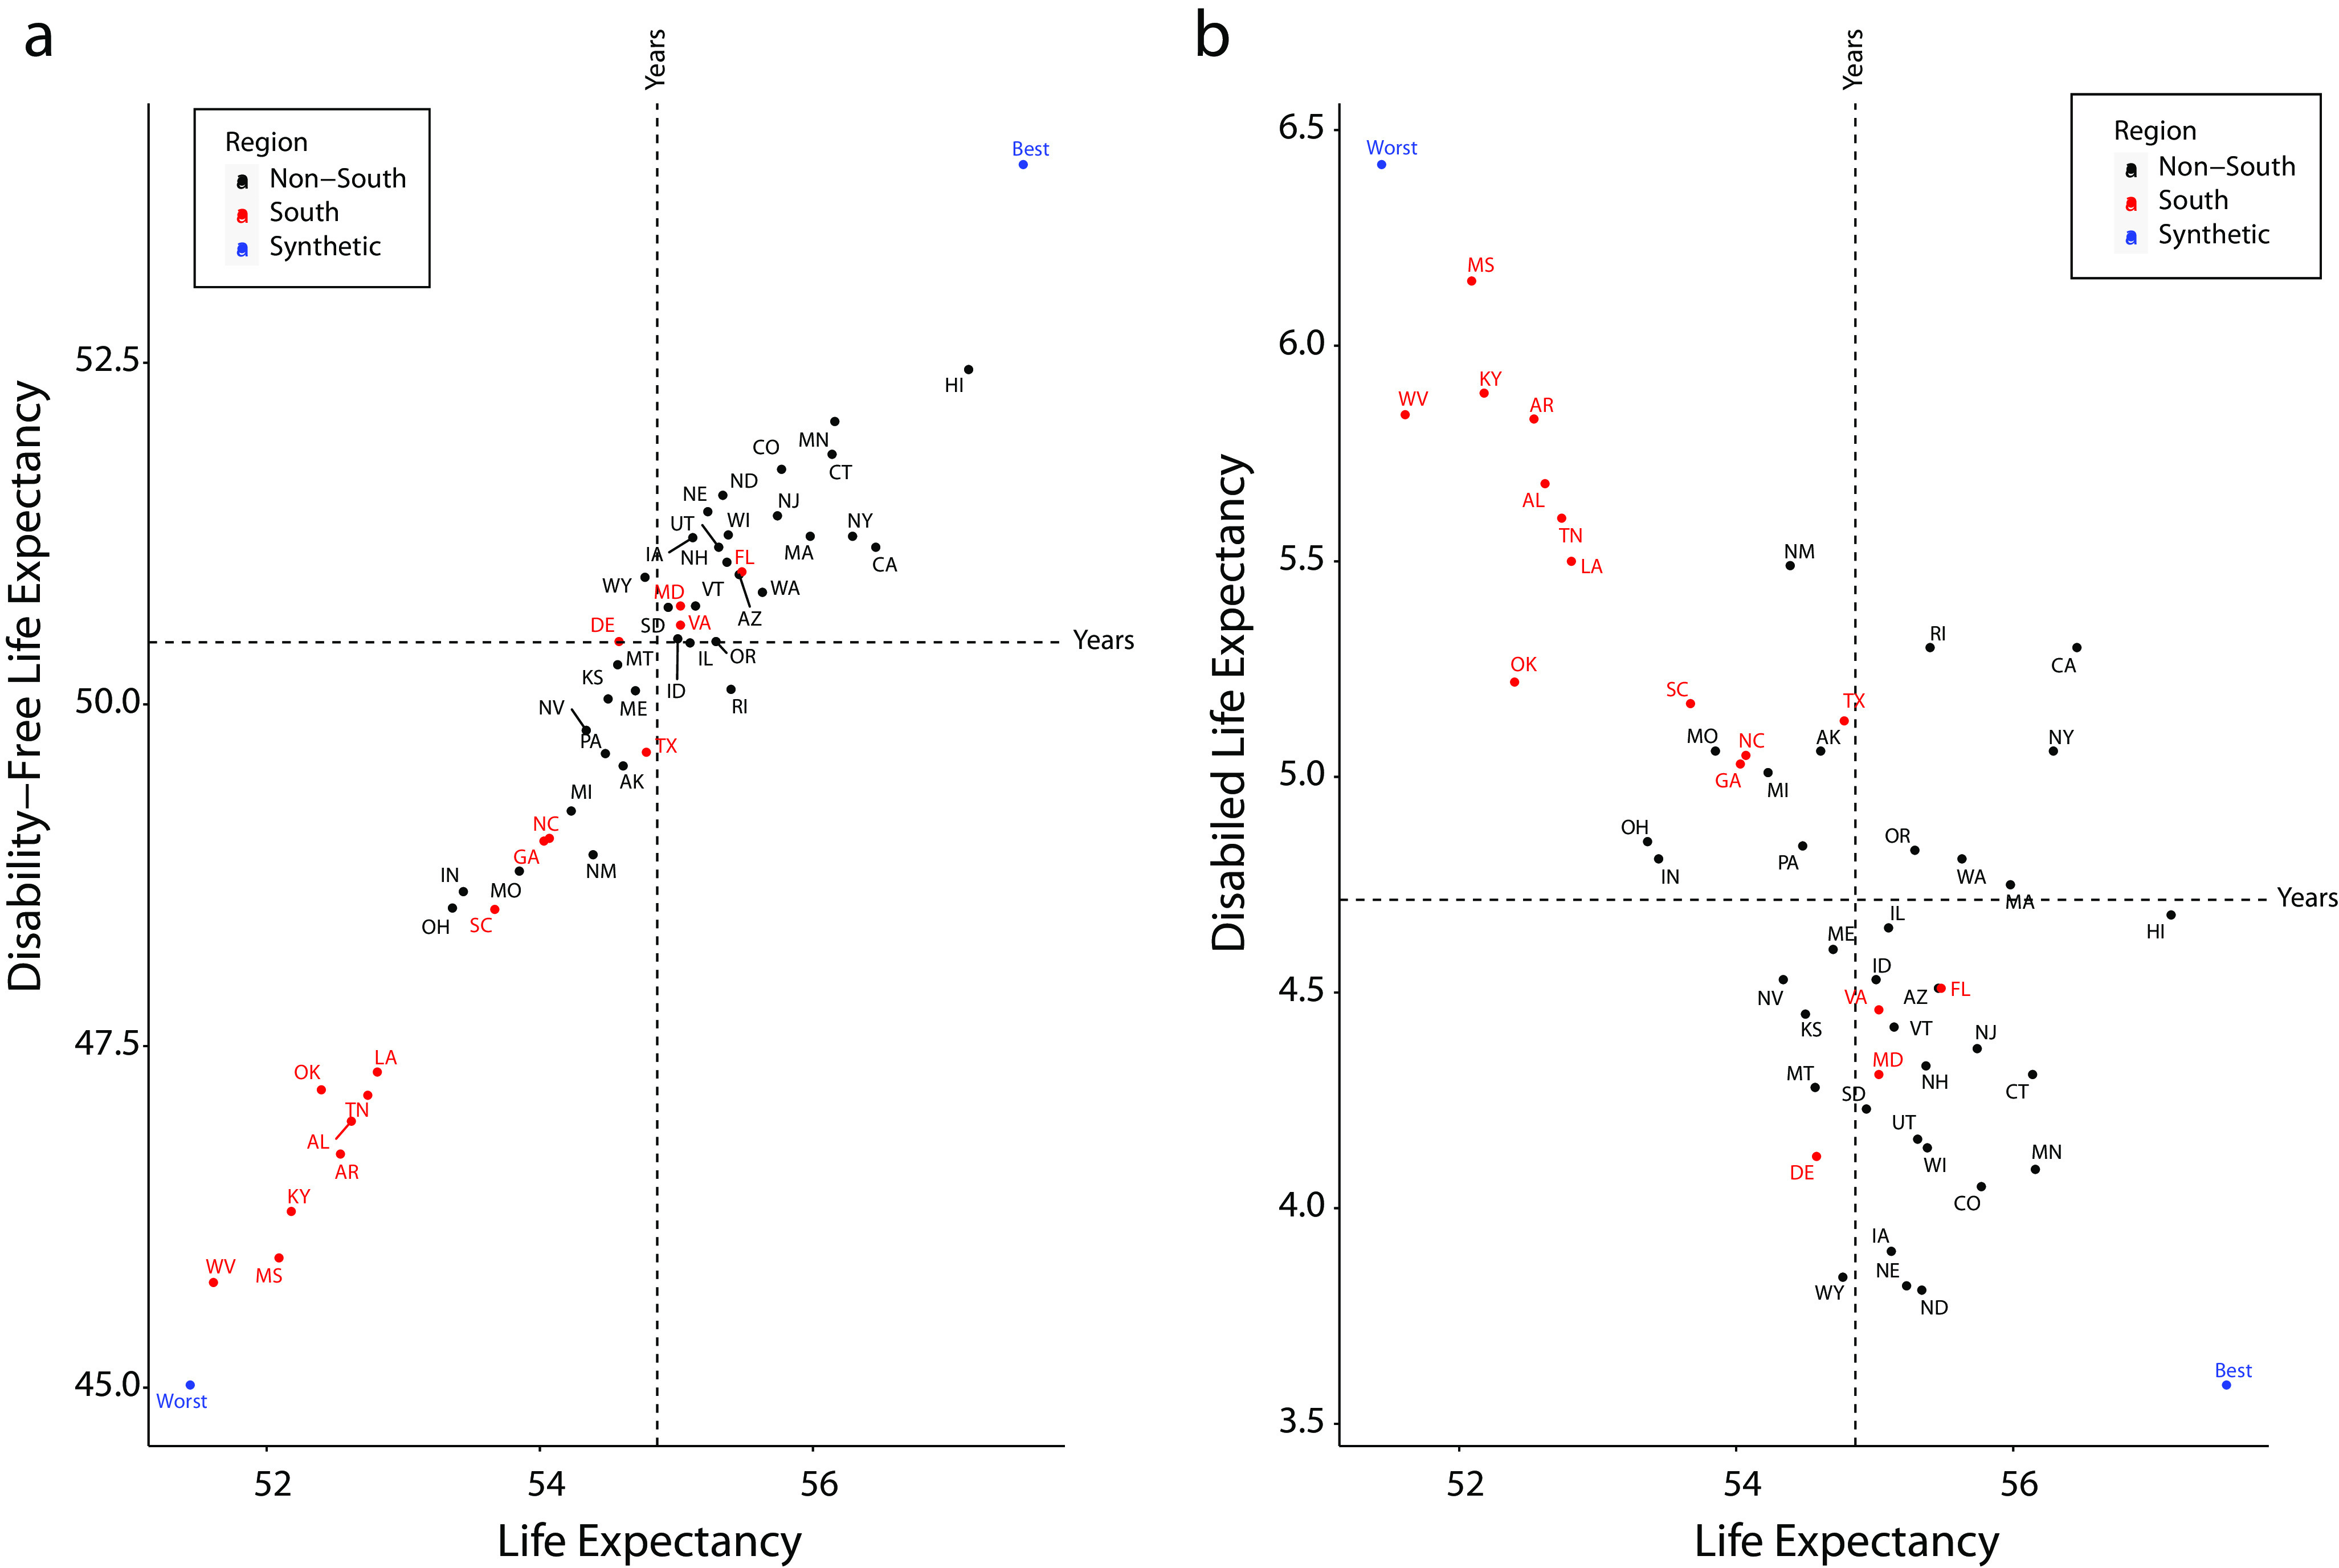
FIGURE 1—

Total Life Expectancy by US State for Women by (a) Disability-Free Life Expectancy and (b) Disabled Life Expectancy: 2013–2017
Note. The 2-letter abbreviations within each figure indicate the US state. The dot indicated by “best” represents a hypothetical state that for each 5-year age band takes on the value of an actual state with the lowest disability (and mortality, respectively). Because no actual US state is “best” at every age band, this hypothetical state has lower disability than any actual state. Following the same technique as best, the dot indicated by “worst” represents the hypothetical worst-case scenario.
