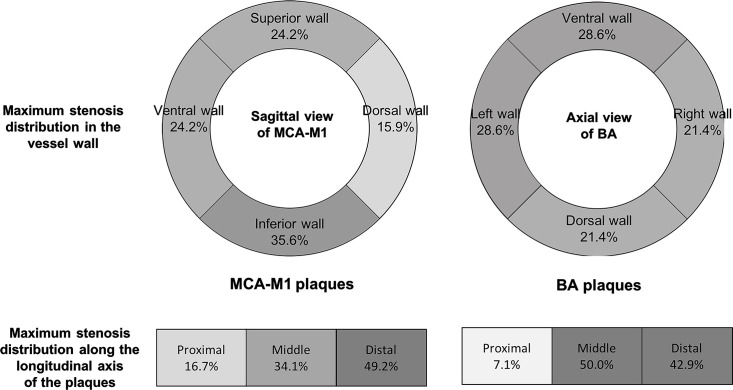
Figure 2.
Maximal stenosis distribution in 132 MCA-M1 plaques and 14 BA plaques by axial and longitudinal views. A darker colour indicates a higher frequency. Upper panel: frequencies of cases with the maximum plaque thickness located over the superior, inferior, ventral and dorsal walls of MCA-M1 (left); or over the ventral, dorsal and lateral walls of BA (right). Lower panel: frequencies of cases with the maximum plaque thickness located at the proximal, middle or distal one-third along the longitudinal axis of MCA-M1 (left) and BA (right) plaques. BA, basilar artery; MCA-M1, M1 middle cerebral artery.

