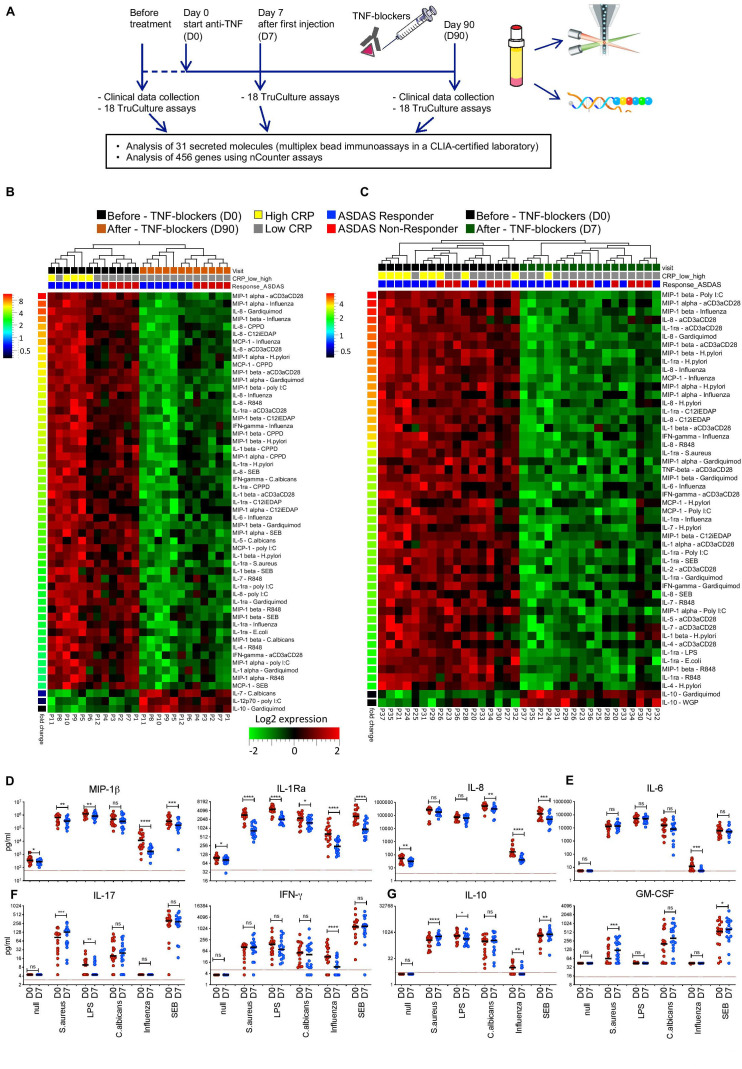
Figure 1.
An immunological signature of antitumour necrosis factor (TNF) therapy. (A) Study design. Blood samples were collected from patients with axial spondyloarthritis (axSpA) prior to (D0), 7 days (D7, for a subset of patients), and 3 months (D90) after beginning TNF inhibitors (TNFi) treatment. Clinical efficacy was monitored at D90 according to the current standard of care. (B) The levels of 31 secreted molecules in response to 18 different immune stimuli were compared in samples from 12 patients at D0 (black rectangles) and D90 (orange rectangles). Patients with C reactive protein (CRP) levels >6 mg/L are marked with yellow rectangles, while CRP levels <6 mg/L are indicated with grey rectangles. Patients responding to anti-TNF therapy (delta ASDAS ≥1.1) are marked in blue and non-responders (delta ASDAS <1.1) are marked in red. The heatmap shows the levels of differentially secreted proteins (paired t-test, FDR≤0.05, fold-change ≥2, red indicates higher and green lower levels of protein secretion). Analyte-stimulus combinations were ranked by decreasing fold change (color-code bar, top left); patient IDs are indicated below the heatmaps. (C) The same analysis as in (B) was performed for additional 17 patients with axSpA, sampled at D0 (blue rectangles) and D7 (green rectangles). (D–G) Levels of proteins identified in (C), for 5 representative stimuli and the unstimulated (null) condition, in 17 patients with axSpA at D0 (red) and D7 (blue). Red lines indicate the least detectable dose (LDD) for each assay. P values were calculated using a Wilcoxon matched-pairs test (patients with SpA D0 vs D7) *: p<0.05; **: p<0.01; ***: p<0.001; ****: p<0.0001; ns, not significant. Horizontal black bars indicate the median. Y-axes are log10 or log2 scales. ASDAS, Ankylosing Spondylitis Disease Activity Score; IFN, interferon; IL, interleukin.

