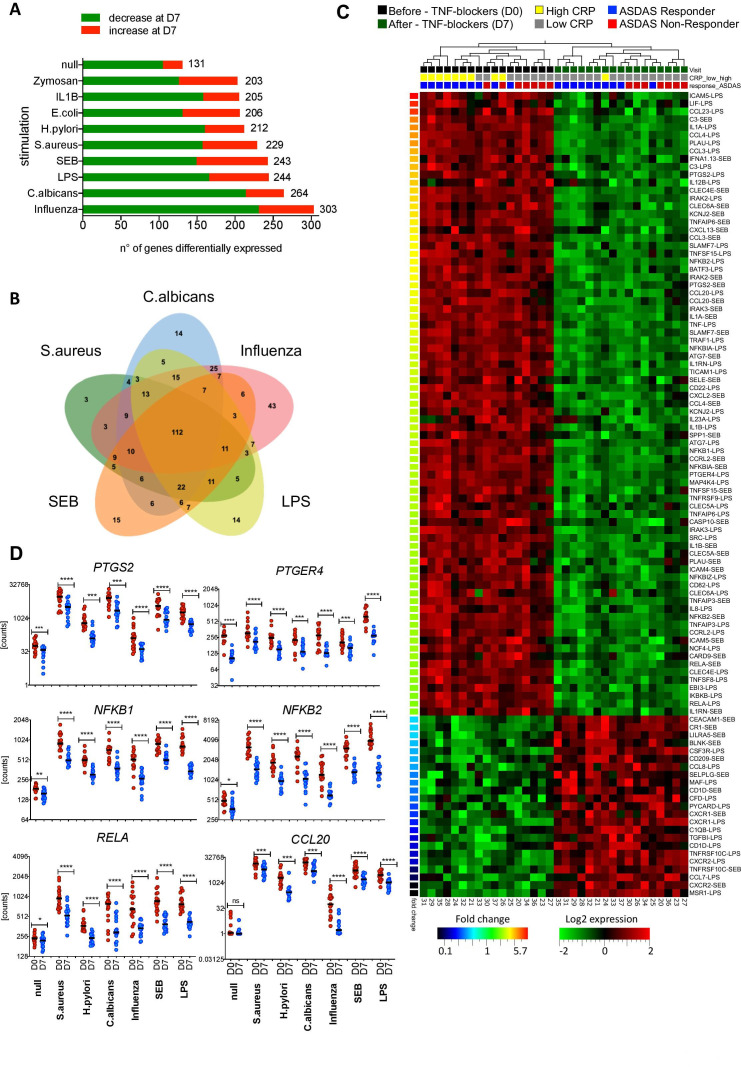
Figure 2.
Tumour necrosis factor (TNF) blockers strongly affect key transcriptional networks of innate immune responses. (A) Number of genes differentially expressed in 10 different TruCulture stimulation assays performed at D0 and D7 (17 patients, paired t-test, false discovery rate (FDR)≤0.05). (B) Venn diagram of the genes differentially expressed as in (A), in five representative stimulation conditions. (C) Heatmap showing the genes most affected by TNF inhibitors (TNFi; D0, black rectangles vs D7, green) in lipopolysaccharides (LPS) and staphylococcal enterotoxin (SEB) stimulation conditions. Patients with C reactive protein (CRP) levels >6 mg/L are marked with yellow rectangles, while CRP levels <6 mg/L are indicated with grey rectangles. Patients responding to anti-TNF therapy (delta Ankylosing Spondylitis Disease Activity Score (ASDAS) ≥1.1) at M3 are marked in blue and non-responders (delta ASDAS <1.1) are marked in red. Paired t-test, FDR≤0.005 and fold-difference threshold of ≥2. Gene-stimulus combinations were ranked by decreasing fold change (colour code bottom left bar). (D) Expression levels of PTGS2, PTGER4, NF-κB family members, and CCL20 for the unstimulated TruCulture assay and five representative stimuli at D0 (red) and D7 (blue) after initiation of TNFi therapy. P values were determined using a Wilcoxon matched-pairs test (D0 vs D7, *: p<0.05; **: p<0.01; ***: p<0.001; ****: p<0.0001; ns, not significant, n=17). Horizontal black bars indicate the median.

