Figure 4.
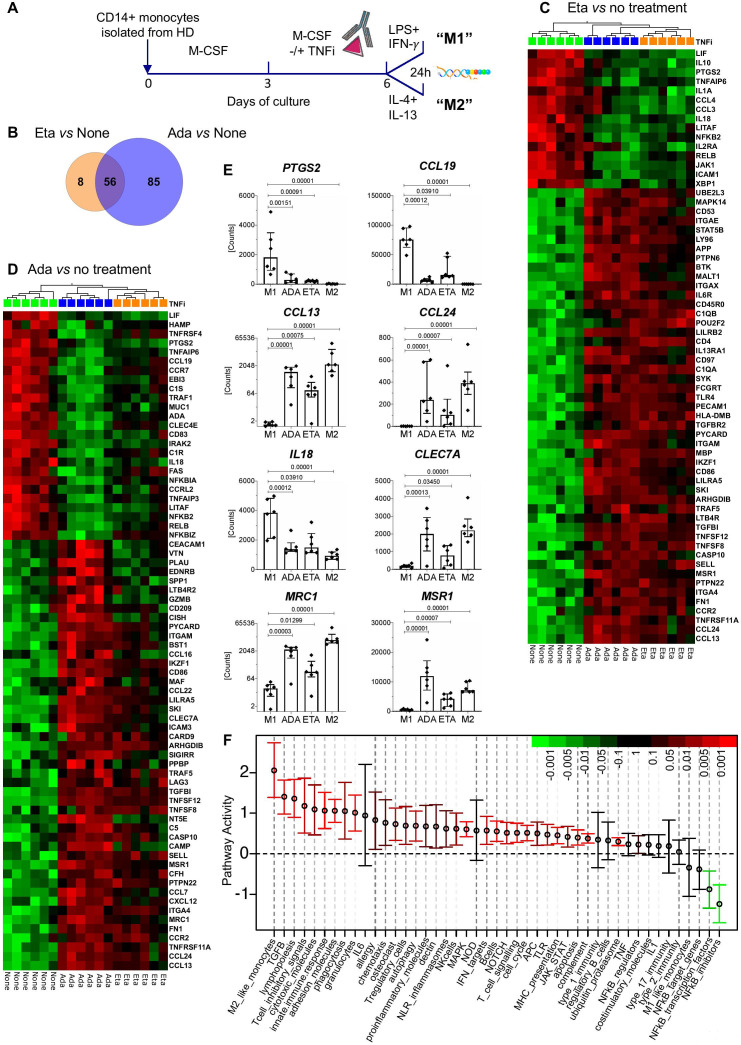
TNF inhibitors (TNFi) have largely overlapping effects on in vitro differentiated M1-type macrophages. (A) Study design. CD14+ cells isolated from healthy donors were differentiated in vitro into macrophages in the presence or absence of etanercept (Eta) or adalimumab (Ada). TNFi were added at day 3 and macrophages were polarised to the M1 subset in the presence or absence of Eta or Ada. Gene expression was analysed with the nCounter Human Immunology v2 panel and with LIMMA (paired sample adjusted p value threshold 0.01). (B) Venn diagram showing the overlap of genes affected by Eta or Ada. Analysis of paired samples with LIMMA, adjusted p value threshold 0.01. (C, D) Heatmaps showing the genes most affected by Eta (orange rectangles) versus no treatment (green rectangles) (C) and Ada (blue rectangles) versus no treatment (D) in macrophages stimulated for 24 hours with LPS and interferon (IFN)-γ (‘M1’ polarisation). (C) Paired t-test, Eta versus no treatment, adjusted p value threshold 0.01. Included are also gene expression levels for Ada-treated samples for the same genes. (D) Paired t-test, Ada versus no treatment and fold-change threshold of ≥2. Included are also gene expression levels for Eta-treated samples for the same genes. Samples were ordered by hierarchical clustering and genes were ranked by decreasing fold change. (E) Shown are the mRNA levels of eight selected genes from (C) and (D) in untreated M1-polarised macrophages (M1), M1 macrophages treated with Ada, M1 macrophages treated with Eta or untreated M2-polarised macrophages (M2). Symbols represent individual data points, boxes the median and whiskers the IQR. Adjusted p values are those of the LIMMA analysis. (F) Effect of Ada on the activity of 45 gene modules (online supplemental table 5) as in figure 3. For each gene module, the mean activity fold change and 95% CI are plotted and color coded according to their FDR-corrected p values compared with zero. Red and green bars indicate statistically significant increased or decreased module activity, respectively, in M1 polarised macrophages treated with Ada versus no treatment.

