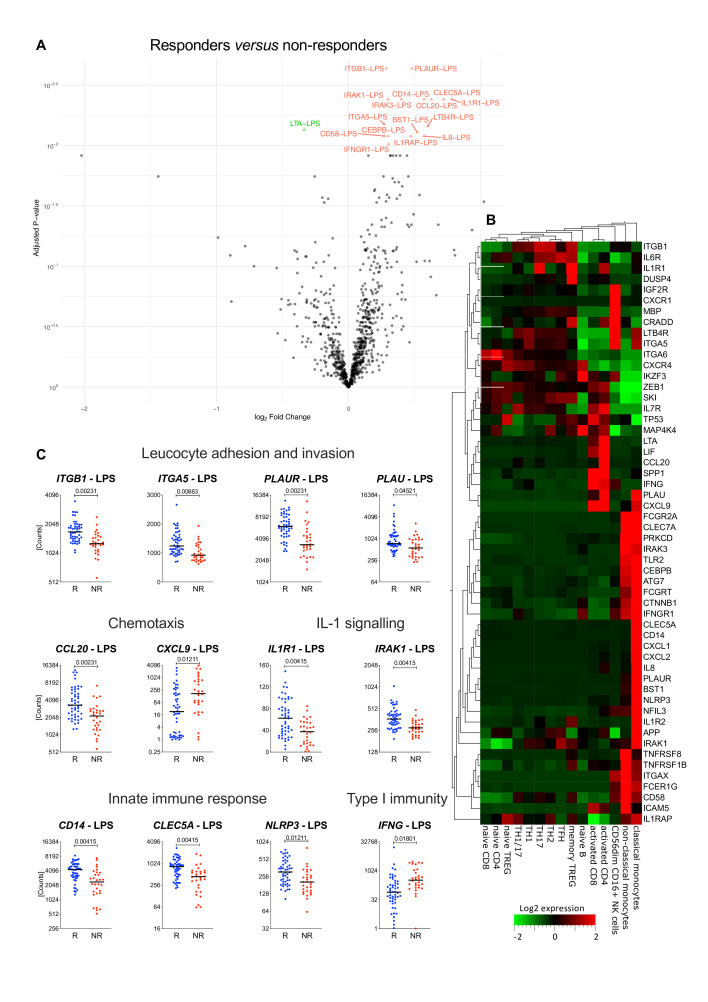
Figure 5.
Immune gene expression associated with therapeutic responses to antitumour necrosis factor (TNF) therapy. (A) Volcano plot representation of genes differentially expressed between 50 patients with spondyloarthritis (SpA) responding to anti-TNF therapy and 30 non-responders in whole-blood cultures stimulated with LPS or SEB before initiation of therapy; red triangles: genes higher in responders; green triangle: higher in non-responders (LIMMA analysis, adjusted p value<0.05). Expression levels and fold-change values of the 58 gene-stimulus combinations (corresponding to 55 genes) that are the most differentially expressed between responders and non-responders are reported in table 2. (B). The heatmap shows the expression levels of the differentially expressed genes in different immune cell subpopulations. Gene expression data were extracted from the DICE database (http://dice-database.org/). (C) The expression levels of selected gene-stimulus combinations correlated with treatment response are plotted before treatment initiation (D0). Patients with major or clinically important improvement of disease activity were grouped together as responders and are represented in blue (R, blue, n=50). Non-responders are represented in red (NR, red, n=30). The horizontal black line represents the median. Statistical significance was tested using LIMMA analysis (responders vs non-responders) and adjusted p values are indicated above the graph. IL, interleukin.

