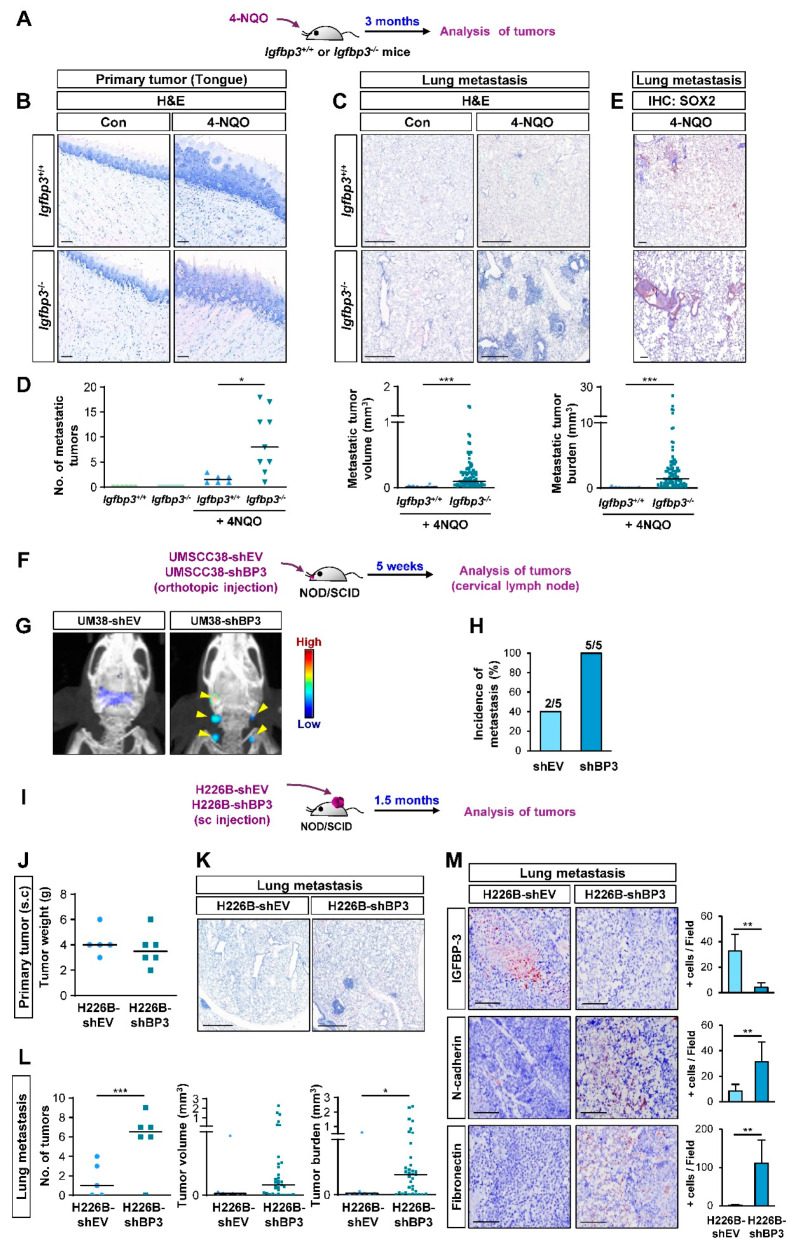
Figure 2.
IGFBP-3 suppresses metastasis in vivo. (A) Schematic diagram illustrating the protocol to assess the impact of IGFBP-3 expression in metastasis of mouse HNSCC using the 4-NQO-induced HNSCC tumorigenesis model (Igfbp3+/+ Con: n = 6; Igfbp3+/+ 4-NQO: n = 7; Igfbp3−/− Con: n = 6; Igfbp3−/− 4-NQO: n = 9). (B,C) Primary (B) and metastatic (C) tumor formation in 4-NQO-administered mice was determined by H&E staining of the tongue (B) and lung (C) tissues. Scale bars: 25 μm (B), 1 mm (C). (D) Microscopic evaluation of the metastatic tumors in the lungs. (E) IHC analysis to determine the level of SOX2 expression in lung tissues. Scale bars: 25 μm. (F) Schematic diagram illustrating the protocol to assess the impact of IGFBP-3 expression in metastasis of human HNSCC using orthotopic tongue xenograft tumor model (n = 5 per group). (G) Representative IVIS images showing metastatic tumor formation in mice bearing UMSCC38-shBP3 tumor xenografts. (H) Microscopic evaluation showing increased metastasis in cervical lymph nodes in mice bearing UMSCC38-shBP3 cells compared with those in UMSCC38-shEV cells. Three cervical lymph nodes per mouse were evaluated. (I) Schematic diagram illustrating the protocol to assess the impact of IGFBP-3 expression in metastasis of human NSCLC using NSCLC xenograft tumor model (shEV: n = 5; shBP3: n = 6). (J) Changes in the weight of primary tumors between H226B-shEV and H226B-shBP3 tumor xenografts. (K,L) Upregulated metastatic tumor formation in mice bearing H226B-shBP3 tumor xenografts compared with those bearing 226B-shEV tumor xenografts, as determined by H&E staining of lung tissue sections (K) and microscopic evaluation of H&E-stained tissues (L). (M) The level of tumoral expression of N-cadherin and fibronectin in H226B-shEV and H226B-shBP3 xenograft tumors was determined by IHC analysis. Scale bars: 1 mm (K), 0.5 mm (M). The bar represents mean ± SD. * p < 0.05, ** p < 0.01, and *** p < 0.001, as determined by Mann-Whitney test (D,L (middle and right), M) and the two-tailed Student’s t-test (L, left) compared with the corresponding control. EV: empty vector; BP3: IGFBP-3.

