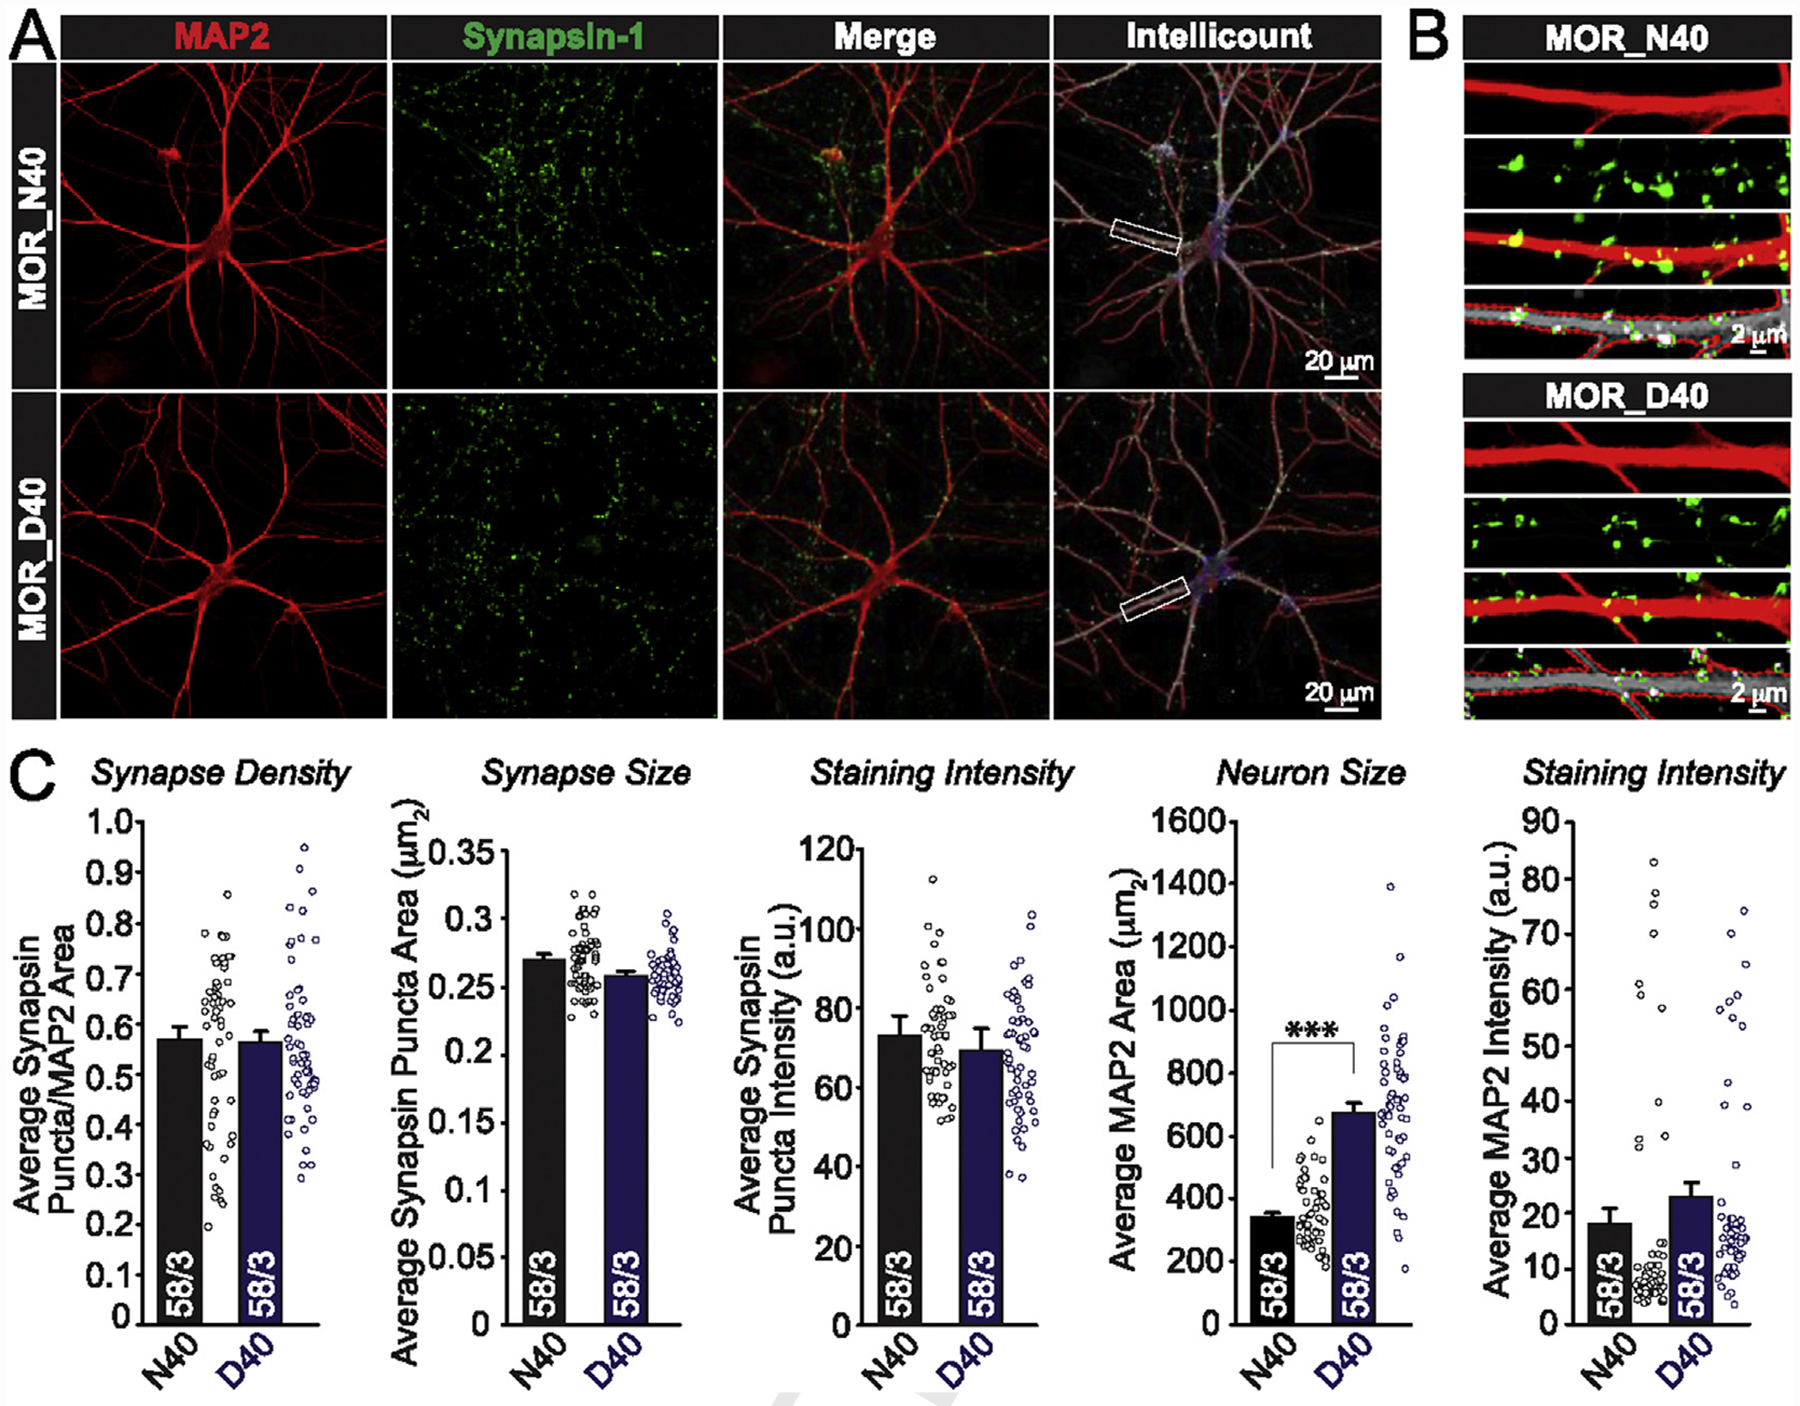
Fig. 2. The MOR genetic variant N40D does not affect synapse formation in human AD-iNs.

(A) Top: Representative confocal images of N40 AD-iNs that were employed for Intellicount analysis. MAP2 (red), Synapsin (green), and Merged images (scale = 20 μm). Bottom: Representative confocal images of D40 AD-iNs that were employed for Intellicount analysis. MAP2 (red), Synapsin (green), and Merged images (scale = 20 μm) (B) Zoomed-in images of the boxed areas in (A) (scale = 2 μm) (C) Quantifications of MAP2-correlated synapse density, synapse size, and staining intensity (Synapsin and MAP2) are not different between genotypes. Average MAP2 area (μm2) is significantly different between iNs harboring N40D MOR allelic variants (***p < 0.001). Paired t test was used to evaluate within-genotype statistical differences (*p < 0.05, **p < 0.01, ***p < 0.001) (NS = no statistical significance found).
