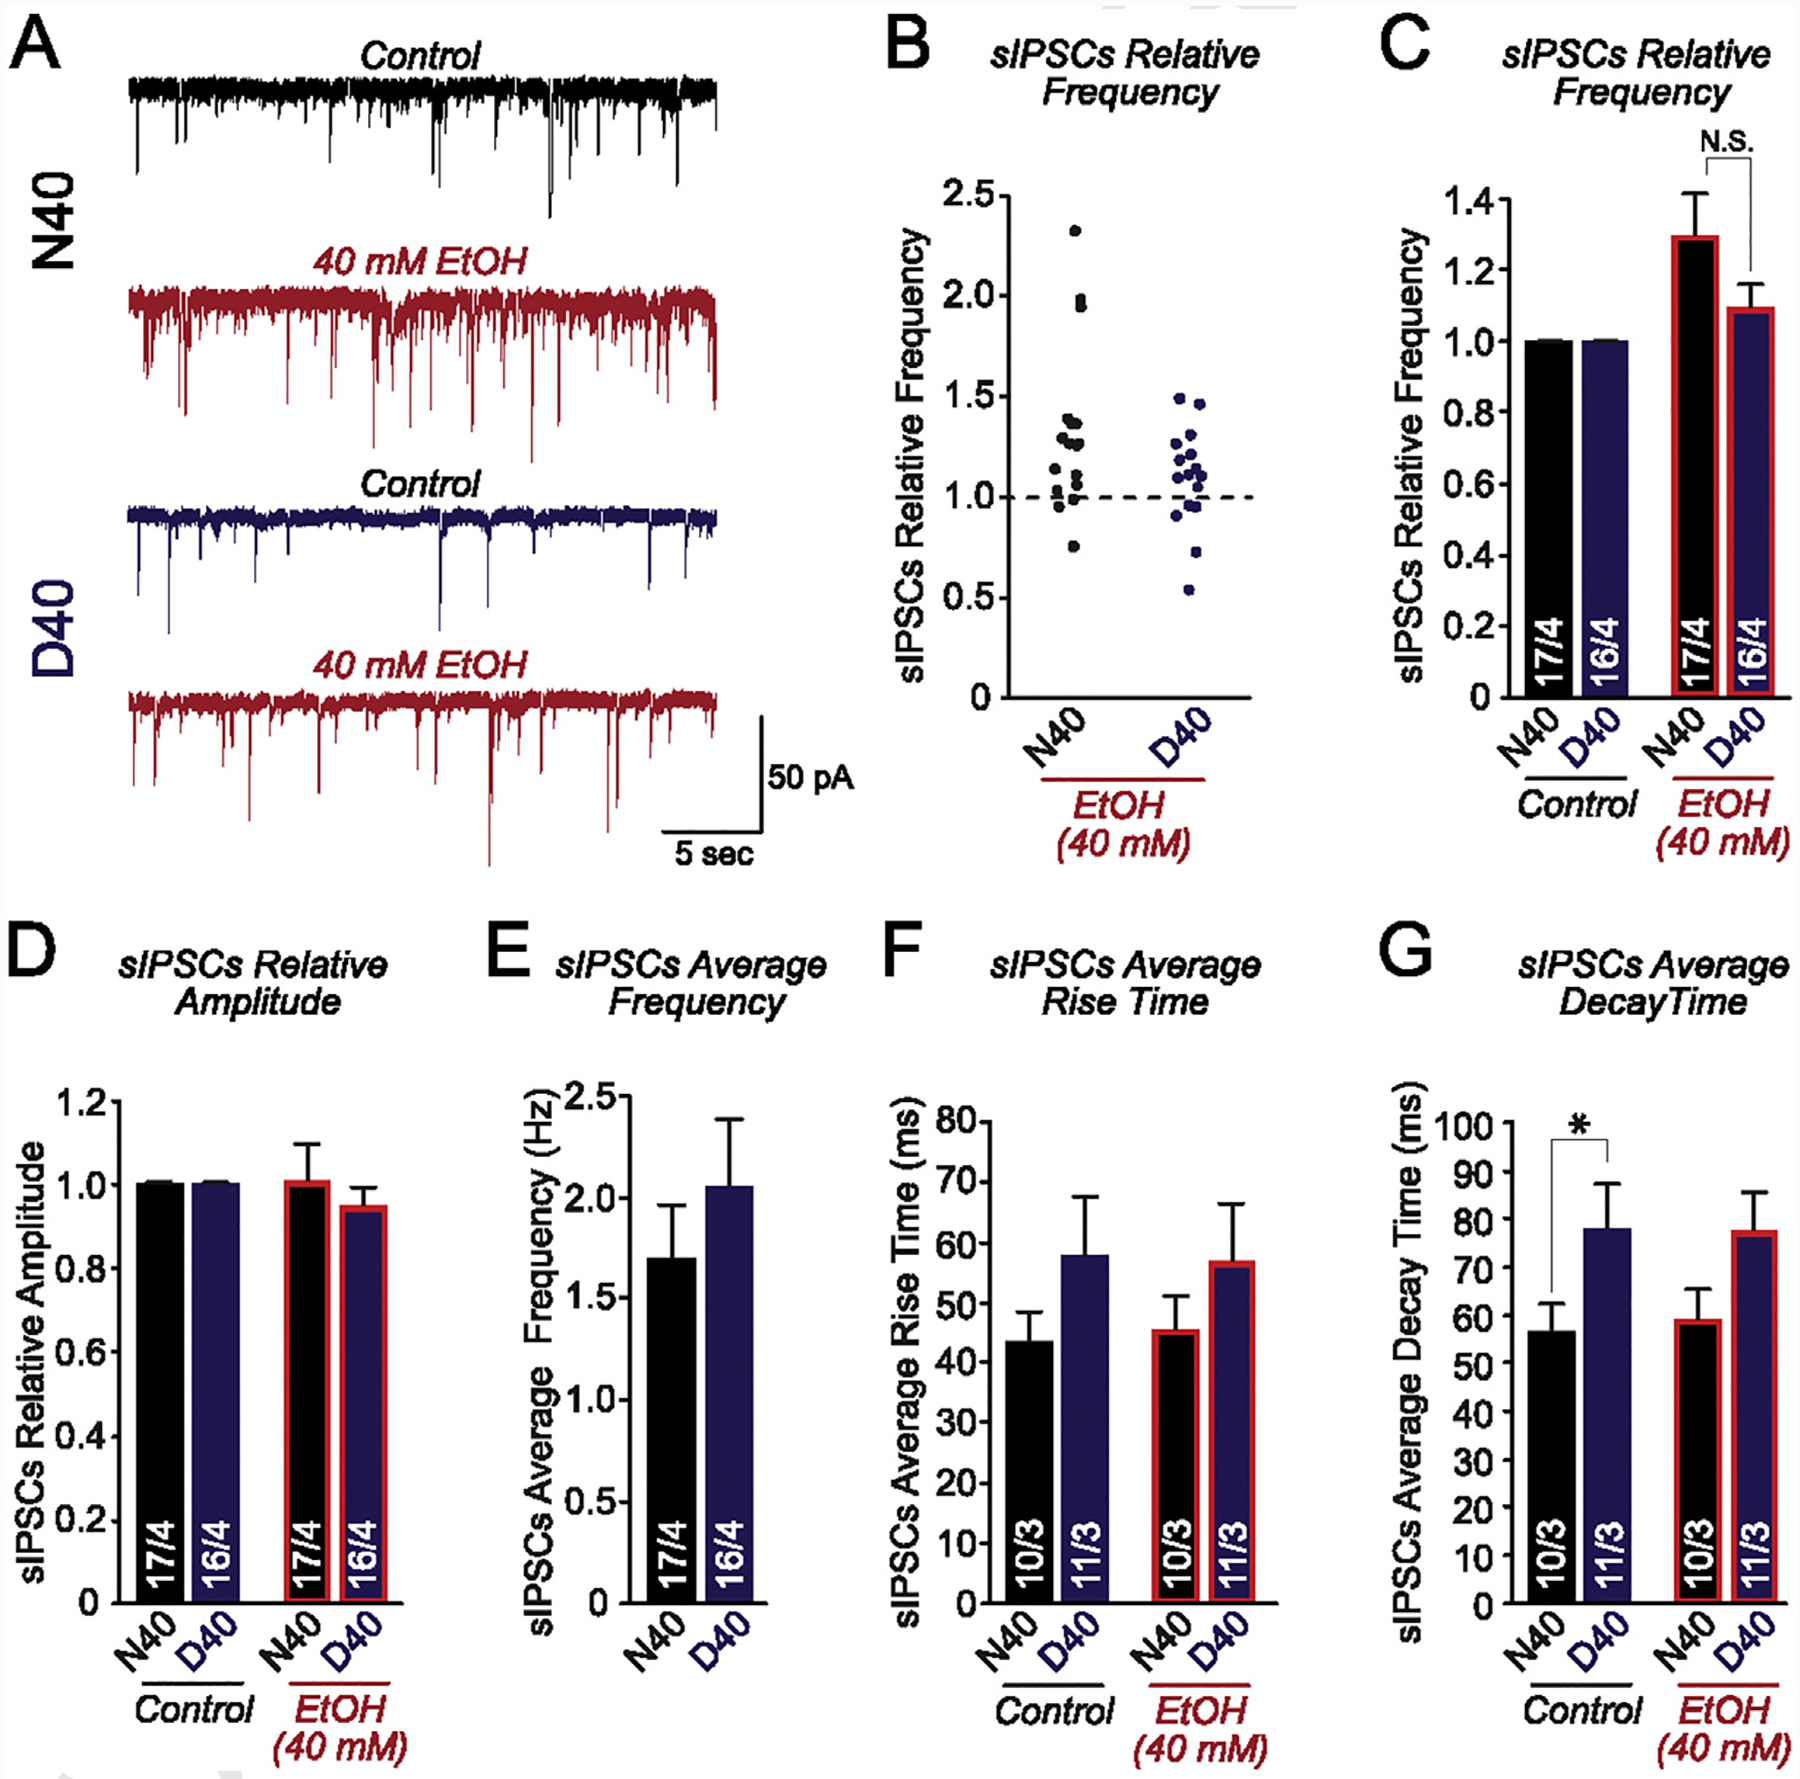
Fig. 3. Acute ethanol application causes an increase in the overall inhibitory tone in human iNs carrying MOR N40.

(A) Representative traces of sIPSCs recorded before [N40 (black) and D40 (blue)] and after acute 40 mM ethanol application (red) (B) Jittered-X graph illustrating the changes in sIPSC frequency in response to acute ethanol application for N40 and D40 AD-iNs. These data are relative to control sIPSC responses (dotted line). Each data point is a recording from an individual iN (C) Quantification of sIPSC frequency changes in response to acute 40 mM ethanol application for iPS-derived N40 and D40 AD-iNs; data are normalized to control (N40EtOH vs. control: p = 0.5; D40EtOH vs. control: p = 0.8) (N40EtOH vs. D40EtOH: p = 0.1) (D) Quantification of sIPSC amplitude changes in response to acute 40 mM ethanol application for iPS-derived N40 and D40 AD-iNs; data are normalized to control (N40EtOH vs. control: p = 0.9; D40EtOH vs. control: p = 0.7) (N40EtOH vs. D40EtOH: p = 0.9) (E) Average sIPSC control frequency comparing N40 to D40 AD-iNs (N40EtOH vs. D40EtOH: p = 0.3) (F) Quantification of average sIPSC rise time changes in response to acute 40 mM ethanol application for iPS cell-derived N40 and D40 AD-iNs (N40EtOH vs. control: p = 0.7; D40EtOH vs. control: p = 0.9; N40 vs. D40 controls: p = 0.2; N40EtOH vs. D40EtOH: p = 0.2) (G) Quantification of average sIPSC decay time changes in response to acute 40 mM ethanol application for iPS cell-derived N40 and D40 AD-iNs (N40EtOH vs. control: p = 0.7; D40EtOH vs. control: p = 0.9; N40 vs. D40 controls: *p ≤ 0.5; N40EtOH vs. D40EtOH: p = 0.09). Data are depicted as means ± SEM. Numbers of cells/number of independently generated cultures analyzed are depicted within the bars. Paired t test was used to evaluate within-genotype statistical differences, and one-way ANOVA was used to evaluate between-genotype statistical differences (*p < 0.05, **p < 0.01, ***p < 0.001) (NS = no statistical significance found).
