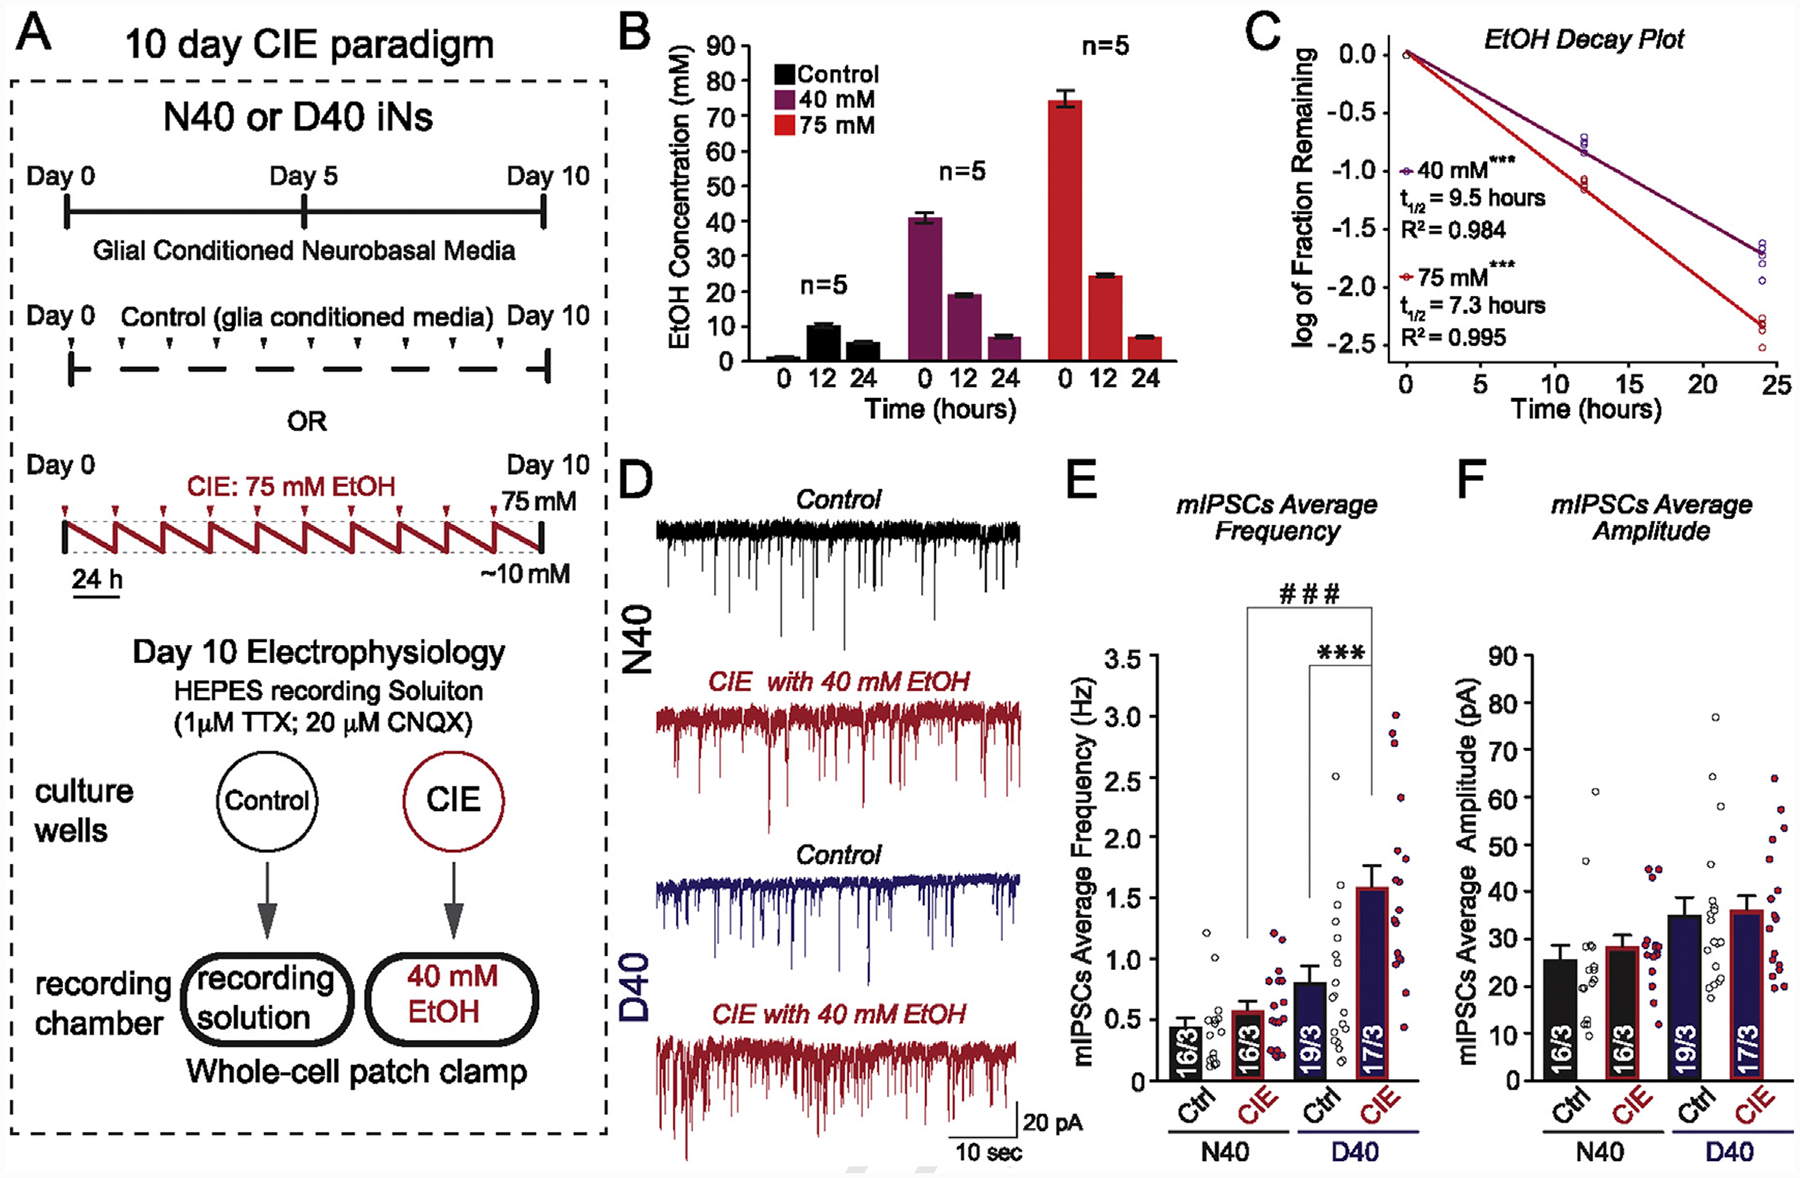
Fig. 5. 10-day chronic intermittent ethanol (CIE) application selectively increases GABAergic transmission in MOR D40 iNs.

(A) Experimental design. Ctrl, control; iNs were treated with glial-conditioned medium with the indicated components daily for a period of 10 days. CIE, chronic intermittent ethanol; iNs were treated with the same medium as control, supplemented with 75 mM ethanol, daily for a period of 10 days (saw tooth red line represents decreasing ethanol concentration as a result of evaporation; red arrows indicate addition of fresh 75 mM ethanol). Following day 10, mIPSCs were recorded: Ctrl iNs were recorded in HEPES recording medium with the indicated components. CIE iNs were recorded in HEPES recording medium supplemented with 40 mM ethanol (acute application) (B) Evaporation of ethanol was examined in culture dishes not containing neural cells by measurement of medium ethanol concentrations (Control, 40 mM, and 75 mM) at 0, 12, and 24 h post-ethanol addition using an AM1 Alcohol Analyzer (C) Half-life of ethanol was determined by plotting the log of the fraction remaining, normalized to initial ethanol concentration. The linear regression fit is plotted as a line (***p value of the fit40mM < 0.001; ***p value of the fit75mM < 0.001). The half-life was calculated from the slope of the fit, as −log (2)/slope (t1/2 for 40 mM = 9.51 h with a 95% confidence interval of 8.85–10.27 h; r2 = 0.984) (t1/2 for 75 mM = 7.05 h with a 95% confidence interval of 6.77–7.34 h; r2 = 0.995) (D) Representative traces of mIPSCs recorded before [N40 (black) and D40 (blue)] and after CIE exposure + 40 mM ethanol acute re-application (red) (E) Quantification of average mIPSC frequency changes in response to CIE and acute 40 mM ethanol re-application for iPS-derived N40 and D40 AD-iNs. Each dot (data point) is a recording from an individual iN (N40EtOH vs. control: p = 0.2; D40EtOH vs. control: ***p ≤ 0.001); (N40EtOH vs. D40EtOH: # # #p ≤ 0.001) (F) Quantification of average mIPSC amplitude changes in response to CIE and acute 40 mM ethanol re-application for iPS-derived N40 and D40 AD-iNs. Each dot (data point) is a recording from an individual iN (N40EtOH vs. control: p = 0.4; D40EtOH vs. control: p = 0.8); (N40EtOH vs. D40EtOH: p = 0.08). Numbers of cells/number of independently generated cultures analyzed are depicted within the bars. Paired t test was used to evaluate within-genotype statistical differences, and one-way ANOVA was used to evaluate between-genotype statistical differences (*p < 0.05, **p < 0.01, ***p < 0.001) (NS = no statistical significance found).
