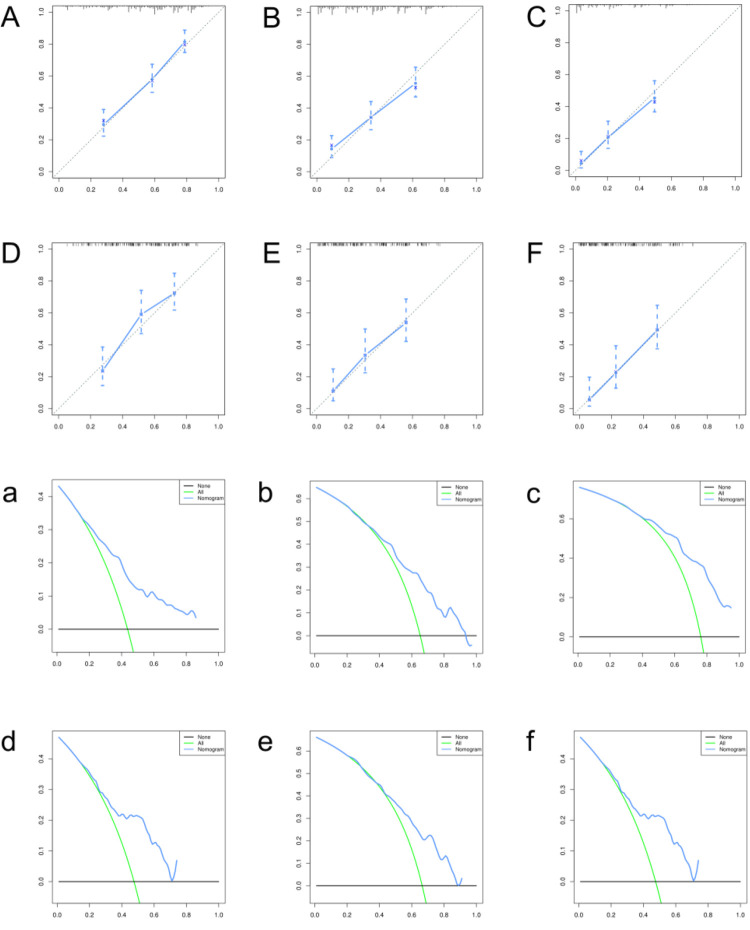
Figure 6.
The calibration curves of the nomogram for predicting overall survival at 1-(A), 2-(B) and 3- years(C) in the training group; the calibration curves of the nomogram at 1-(D), 2-(E) and 3 years(F) in the validation group; decision curve analysis (DCA) of the nomogram at 1-(a), 2-(b) and 3 years(c) in the training group; DCA of the nomogram at 1-(d), 2-(e) and 3-years(f) in the validation group.

