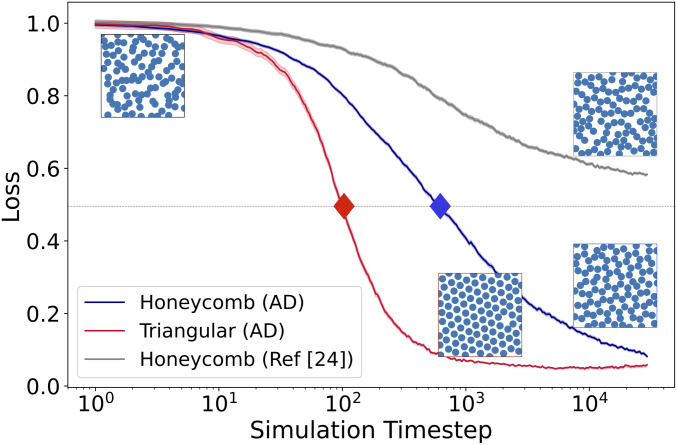
Fig. 1.
Assembly process for honeycomb and triangular lattices. Two different loss functions are pictured: a honeycomb loss and a triangular loss. The honeycomb loss is shown in blue for the parameters found using AD and in gray for the parameters found by Rechtsman et al. (24), whereas the triangular loss is shown in red. The two corresponding potentials are shown in SI Appendix. Each curve is averaged over 200 independent simulations, while the triangular lattice simulations are performed under a higher density than the honeycomb lattice simulations. The three images on the right-hand side are representative examples of the assembled lattice structures. The bottom two images use the same set of parameters as found using AD but have different volume fractions. The image in the upper left shows a sample random initial configuration. In order to extract assembly rates, we note the time at which the lattices are half-assembled, demarcated with a diamond.

