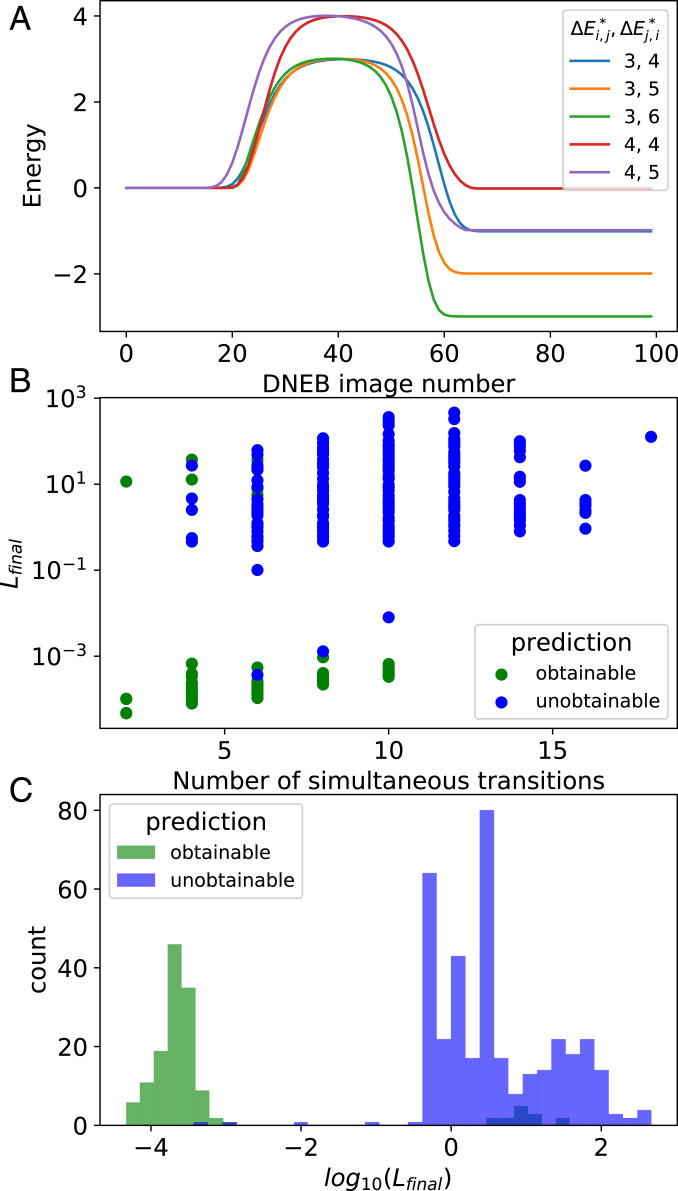
Fig. 5.
(A) Energy (in ) along the steepest descent paths connecting a single starting structure with five adjacent structures, obtained through the DNEB method (Fig. 3 and SI Appendix). These results are after the simultaneous optimization of all 10 energy barriers (target energy barriers [in ] are shown in the legend). The observed energy barriers are within of their targets. (B) The loss function after attempting to simultaneously control the dynamics of multiple transitions, as a function of the number of transitions. Due to the form of the loss function (Eq. 5), simultaneous control is successful when . In practice, when we obtain , this can be further reduced by additional optimization with smaller learning rates, indicating that the transition dynamics can indeed be controlled to a desired precision. The data are colored according to the Hessian-based prediction discussed in the text: green (blue) data correspond to cases where we predicted that simultaneous control could be (could not be) obtained. (C) Histogram of for all data shown in B.

