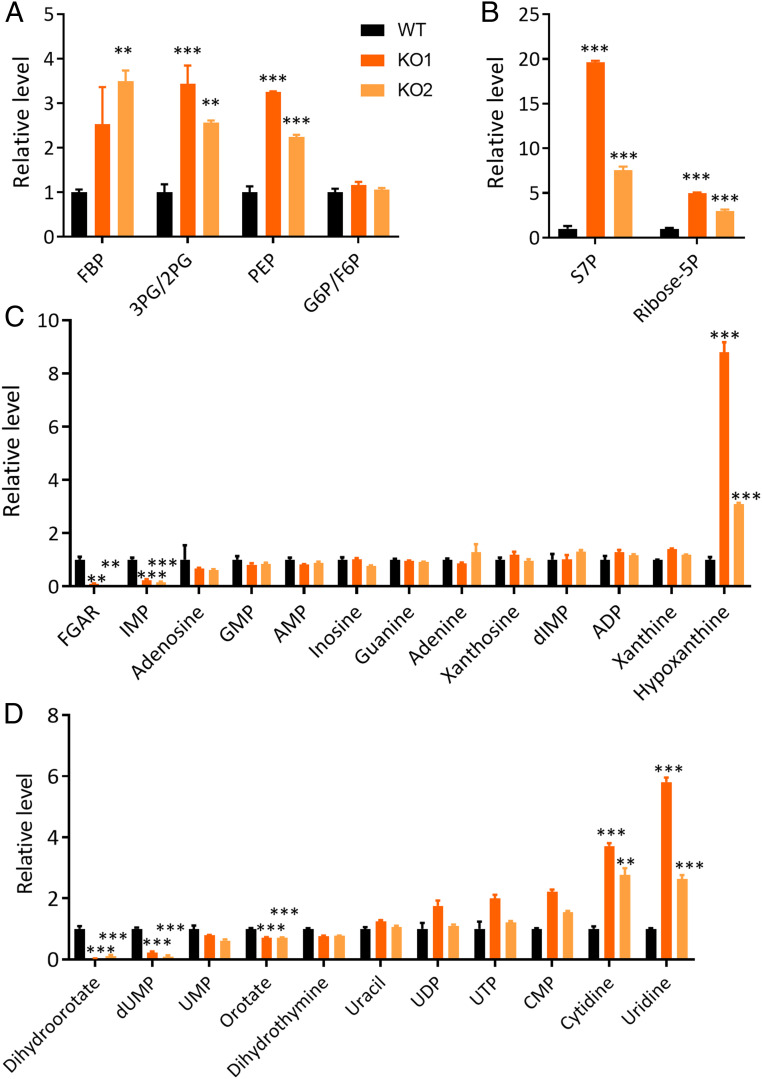
Fig. 2.
Selected changes in levels of steady-state metabolites following KO of PPIP5Ks from HCT116 cells. (A) Relative integrated peak intensities for glycolysis pathway metabolites in WT HCT116 cells (black bars), PPIP5K KO1 cells (dark orange bars), and PPIP5K KO2 cells (light orange bars) following culture in low-glucose media for 24 h: FBP (fructose-1,6-bisphosphate), 3PG/2PG (3-phosphoglycerate/2-phosphoglycerate), PEP (phosphoenolpyruvate), and G6P/F6P (glucose-6-phosphate/fructose-6-phosphate). (B) Relative integrated peak intensities for pentose phosphate pathway metabolites: S7P (sedoheptulose-7-phosphate) and ribose-5P (ribose-5-phosphate). (C) Relative integrated peak intensities for purine biosynthetic precursors: FGAR (phosphoribosyl-N-formylglycineamide), IMP, GMP, AMP, dIMP (deoxyinosine monophosphate), ADP (adenosine diphosphate), and ATP. (D) Relative integrated peak intensities for pyrimidine biosynthetic precursors: dUMP (deoxyuridine monophosphate), UMP, UDP (uridine diphosphate), UTP (uridine triphosphate), and CMP (cytidine monophosphate). The complete analysis is provided in Dataset S1. Student’s t test was used to determine statistical significance of differences between means (**P < 0.01, ***P < 0.001).

